

MORPHOMETRIC CONTROL OF BREEDING IN THE HONEYBEE
tekst: Dorotea Kauhausen-Keller, Roland Keller
Pszczelnicze Zeszyty Naukowe, Rok XL, 1996 — Dorotea Kauhausen-Keller, Roland Keller
strona 127PSZCZELNICZE ZESZYTY NAUKOWE Rok XL, Nr 2 1996
Dorotea Kauhausen-Keller, Roland Keller
Länderinstitut für Bienenkunde, Friedrich-Engels-Str. 32, 16540 Hohen Neuendorf, GERMANY
Summary
An improved method for the intraspecific taxonomy of honeybees has been developed and tested on three different samples of pure-race: A.m. carnica, A.m. mellifera, and the artificial race „Buckfast”. Based on twenty-six characteristics on the fore- and hind wing, they can be well separated using a discriminant analysis, and further samples can be classified according to degree of racial purity or hybridisation. This method can be applied to breeding lines as well.
Keywords: morphometric analysis, A.m. carnica, A.m. mellifera, Buckfast
INTRODUCTION
Nearly a century ago, honeybees in Germany were strongly hybridized due to importations of honeybee queens of other races, so that the autochthone bee race Apis mellifera mellifera was believed to be extinct. Leftover was assumed to be a »land bee« that means a hybrid of several races, mainly A. m. mellifera, A.m. carnica, A.m. ligustica, and A.m. caucasica. Because of this, the decision was made to support the pure breeding of a very successful geographic race: Apis mellifera carnica. This was possible because this race was autochtone and pure-bred in Austria and Slovenia.
Imports of honeybee queens into Germany are still taking place. A very popular import is the artificial race »Buckfast«. To a lesser extend, new imports of the autochthone A.m. mellifera have also taken place.
For this reason, a method for a quick classification of local populations throughout the country as to their extent of pure racial characteristics, or degree of hybridisation is needed.
Morphometric analysis is an improved method for the intraspecific taxonomy of honeybees (Kauhausen, 1987; Ruttner, 1953; Ruttner 1988) and has been developed further for the discrimination of populations within the subspecies (Kauhausen-Keller and Keller 1994).
strona 128The present study is made to find out if the method is suitable or enough sensitive to discriminate between A.m. carnica and Buckfast and between breeding lines of A. m. carnica in order to control mating.
MATERIALS AND METHODS
ORIGIN OF BEE SAMPLES
Twenty-three samples of A.m. carnica, as well as 18 samples of Buckfast, were collected from pure-race breeders throughout Germany. Ten samples of pure-race A.m. mellifera were taken from the data bank at the bee institute in Oberursel. The size of each sample was 20 bees. A total of 34 samples consisting of different breeding lines and different breeders in Germany and Austria were analysed morphometrically and grouped by the given lineage.
MORPHOMETRIC CHARACTERISTICS
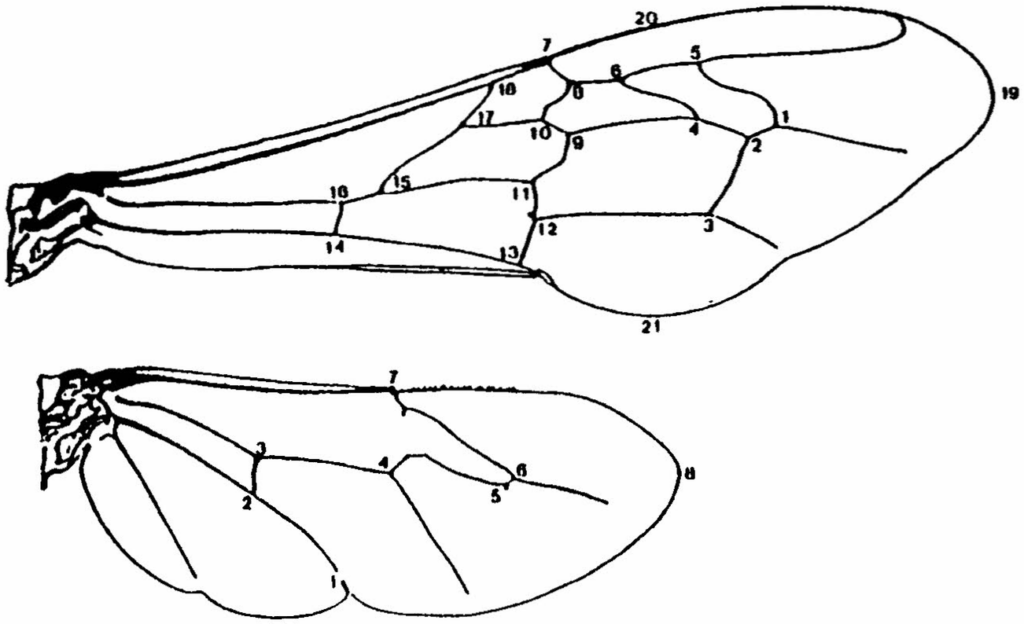
Fig. 1 Coordinates taken on both wings of the honeybee.
strona 129T a b l e 1
| Morphometric character | Distance or angle between coordinates |
|---|---|
| Forewing | |
| Length | 14-19 |
| Width | 20-21 |
| Cubital vein „a” | 2-4 |
| Cubital vein „b” | 1-2 |
| Angle A4 | 4-1-5 |
| Angle B4 | 1-4-5 |
| Angle D7 | 4-3-13 |
| Angle E9 | 6-5-9 |
| Angle G18 | 12-13-14 |
| Angle J10 | 9-10-6 |
| Angle J16 | 8-10-18 |
| Angle K19 | 12-11-14 |
| Angle L13 | 6-7-5 |
| Angle N23 | 17-18-10 |
| Angle O26 | 16-14-15 |
| Hindwing | |
| L1 | 1-2 |
| L2 | 2-3 |
| L3 | 3-4 |
| L4 | 4-5 |
| L5 | 5-6 |
| L6 | 6-7 |
| L7 | 1-7 |
| L8 | 2-8 |
| Angle W1 | 1-2-3 |
| Angle W2 | 2-3-4 |
| Angle W3 | 4-6-7 |
Altogether, 26 characteristics of the outer morphology were measured in each bee: four sections and 11 angles in the wing venation of the forewing; eight sections and three angles on the hindwing (DuPraw 1965). These were taken by mounting the wings on slides, which were then photographed by a video camera which projected an image of the wing on a computer monitor. With the help of a mouse pointer, 21 points were located (mouse click) on the forewing, and 8 points on the hind wing (fig.1). With the help of a computer program, 26 characteristics were computed from the mouse coordinates and stored in a data bank (table 1). For the differentiation between A. m. carnica and Buckfast two characteristics of pigmentation were also compared.
ANALYSIS
The compared samples were grouped by their origin, and their separation was tested by a multivariate discriminant analysis. The distance of the groups represented with a confidence ellipse (fig. 2) reflects the morphological kinship of the populations. The confidence ellipse (Cornuet, 1982) is a helpful device for defining a space representing each group, since each group has a different internal variability. The confidence level represented is 75%, i.e. 75% of the population is supposedly located within the ellipse. The individual samples inside each ellipse are shown by a coordinate point calculated out of the mean values of the 20 bees in each sample.
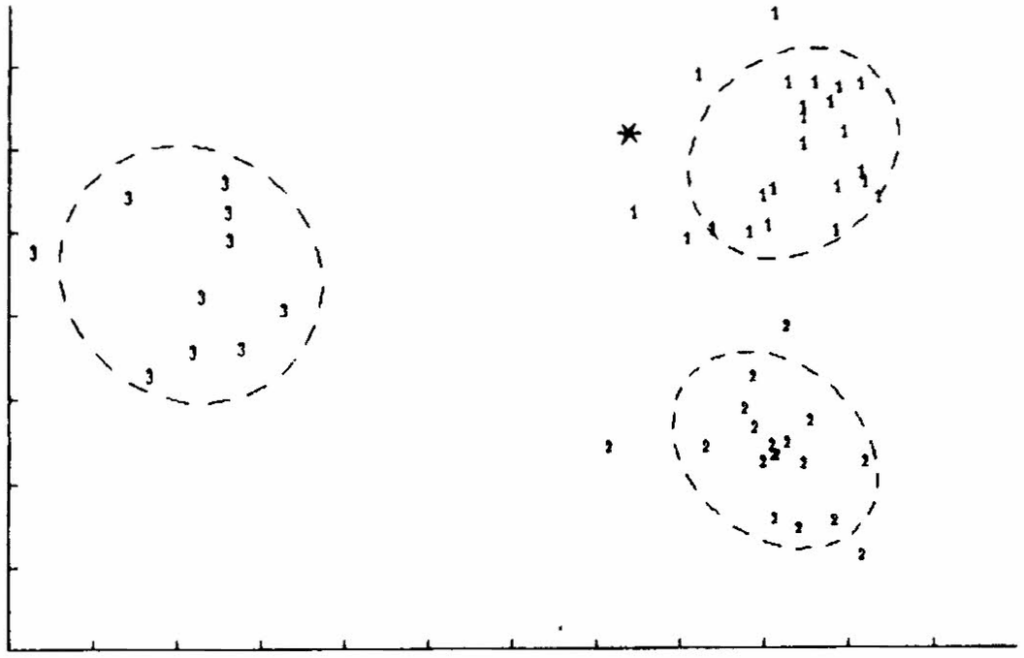
Fig. 2 Discriminant analysis with groups A. m. carnica (1), Buckfast (2) an A. m. mellifera (3) an classification of a new sample(*). Broken lines are confidence ellipses for each group at a 75% level of confidence.
strona 131The discriminant function determined through this analysis may then used to classify further samples of interest (represented in fig. 2 with a „*”). Using this method, it is possible to classify any honey bee sample in correspondence to the ellipses of the given groups (pure races, breeding lines etc)
RESULTS
All three representative groups (A. m. mellifera, A. m. carnica, Buckfast) are shown to be well separated on the 75% confidence level. The groups A.m. carnica and Buckfast are close together, and both show a greater distance to A. m. mellifera (fig. 2). The discriminant functions of the analysis are adapted to be used in classifying further samples. In case of hybrids it is, however, not always clear what hybrid combination has taken place, because hybrids show not necessarily an intermediate score of the characteristics. A sample half-way between A. m. carnica and A. m. mellifera does not necessarily mean that a half-half combination of A. m. carnica with A. m. mellifera or revers, has taken place. This analysis only shows a drift away from the pure-bred centre, but does not yield a measure of the type of combination.
The main characteristics that seperate A. m. carnica from Buckfast are shown in table 2.
T a b l e 2
| Characteristic | A. m. carnica mean (δ | Buckfast mean (δ) |
|---|---|---|
| Length of forewing | 671,2 (10,2) | 657,3 (10,4) (x .01 mm) |
| Width of forwing | 319,4 ( 9,5) | 311,4 ( 7,3) (x .01 mm) |
| Pigmentation of tergite 2 | 1.2 (1.4) | 6.5 (2.7) (class) |
| Pigmentation of tergite 3 | 2.3 (0.7) | 6.1 (1.7) (class) |
Apart from the wing characteristics, there is a very obvious pigmentation difference on tergite 2 und 3 between the Buckfast breeding lines in our analysis and A. m. carnica, which makes it easy to identify those Buckfast bees by eye only.
The analysis of breeding lines within the subspecies A. m. carnica showed a good discrimination of all groups, with the samples from Lunz (Austria) and the Sklenar-line farest away from the other lines hold in
strona 132Germany.
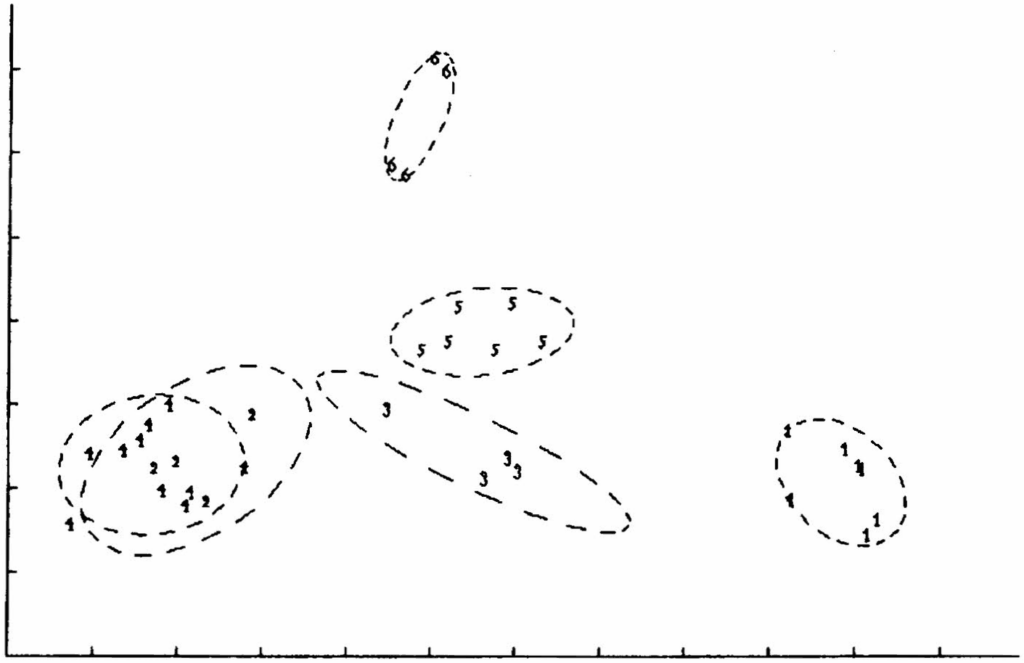
Fig. 3 Discriminant analysis with six subgroups (breeding lines) of A. m. carnica (1 Lunz, 2 Peschetz, 3 Bukovsek, 4 Hofmann, 5 Celle, 6 Sklenar). Broken lines are 95% confidence ellipses. Groups 2 and 4 lie spatially over each other without touching.
DISCUSSION
The results have shown a general usefulness of this method for the control of mating both between breeding-lines and for the investigation of local area for racial purity or hybridisation. Unless there is a great deal of importation, or dislocation of queens from one area to another, a local identity for each population can be established.
Most collected samples outside from the group of pure bred samples, turned out to be hybrids to some degree. Exactly what form of hybridisation or combination with other races, cannot be determined with this dataset. The samples taken from certified breeders showed more racial purity.
The accuracy of the results dependends very much on the accuracy of measurement, the number of characteristics included in the analysis, and the sample size. A sample size of 20 bees has proven to be sufficient, while increasing the number of characteristics in the analysis brought improvements on discriminating between populations only as far as the
strona 133characteristics were non-correlated with each other. The greatest source of inaccuracy was the precision of measurement. Each individual bee in a population varies from its sisters to a small extent. However, an average of a population is taken, and represented by a position in the graph. On the other hand, if there is a considerable difference when measuring one bee several times (lack of sufficient repeatability), that will affect the computed position. To minimize this error, a great extent of automatisation has been built into the computer software with the goal to get the same results for different persons measuring the same sample, hence minimizing systematic errors and increasing the resolution.
REFERENCES
DuPraw E.J. (1965) – The recognition and handling of honeybee specimens in Non-Linnean Taxonomy. J. Apic. Res. 71-84
Cornuet J. M. (1982) – Représentation graphique de populations multinormales par des ellipses de confiance. Apidologie 13, 15-20
Kauhausen D. (1987) – Über den Einsatz multivariater statistischer Methoden zur infraspezifischen Taxonomie der Honigbiene (Apis mellifera L.). Inaugural-Dissertation J. W. Goethe-Universität, Frankfurt/Main
Kauhausen-Keller D., Keller R. (1994) – Morphometrical control of pure race breeding in the honeybee (Apis mellifera L). Apidologie 25, 133-143
Ruttner F. (1953) – Über die Vererbung einiger Rassenmerkmale bei der Honigbiene (Apis mellifica). Österr. Zool. Z. IV,183-190
Ruttner F. (1988) – Biogeography and Taxonomy of the Honeybee. Springer-Verlag, Berlin
Ruttner F., Tassencourt L., Louveaux J. (1978) – Biometrical-statistical analysis of the geographic variability of Apis mellifera L. I. Material and methods. Apidologie 9, 363-381
KONTROLA HODOWLI PSZCZÓŁ PRZY POMOCY BADAŃ MORFOLOGICZNYCH
D. Kauhausen-Keller, R. Keller
Streszczenie
W Europie Środkowej utrzymuje się przeważnie rasę kraińską. Niemała część pszczelarzy jednak faworyzuje pszczołę Buckfast, którą importują, ale także hodują w rejonach występowania pszczoły kraińskiej. Najnowsze badania morfometryczne wykazały brak istotnych różnic statystycznych pomiędzy obu populacjami, występującymi na obszarze Niemiec. Przedstawiono wyniki badań użyłkowania skrzydeł i ubarwienia 3 ras pszczół: A.m. carnica, A.m. mellifera i Buckfast.
Słowa kluczowe: badania morfologiczne, A.m. carnica, A.m. mellifera, Buckfast
Errata — błędy druku znalezione podczas digitalizacji
- s. 127: „autochtone” → autochthone
- s. 127: „lesser extend” → lesser extent
- s. 130, ryc. 2: „Buckfast (2) an” → Buckfast (2) and
- s. 130, ryc. 2: „(3) an classification” → (3) and classification
- s. 131: „seperate” → separate
- s. 131, tab. 2: „forwing” → forewing
- s. 131: „farest” → farthest
- s. 132: „dependends” → depends