

LIGHT-BODIED FEMALES AS A PARAMETER USEFUL IN THE ASSESSMENT OF THE INFESTATION OF BEE COLONIES BY THE MITE VARROA JACOBSONI
tekst: Małgorzata Bieńkowska, Zofia Konopacka
Pszczelnicze Zeszyty Naukowe, Rok XLIV, Nr 2, 2000 — Małgorzata Bieńkowska, Zofia Konopacka
strona 185PSZCZELNICZE ZESZYTY NAUKOWE Rok XLIV, Nr 2 2000
Małgorzata Bieńkowska, Zofia Konopacka
Research Institute of Pomology and Floriculture Apiculture Division, 24-100 Puławy, ul. Kazimierska 2
Summary
In the natural fall of dead mites along with dark females which die natural death and fall to the hive bottom as well as males and developmental stages of the mite removed by bees during cell cleaning there are also light non-coloured females. They come out of the cells together with emerging insects but are incapable of survival. The death rate of the parasite and the proportion of light and dark-coloured females in the total number of dead mites are closely related to brood emergence and to the kind of emerging brood.
The proportion of light-coloured females in the natural fall of dead mites varies and may reach 49%, 70% and even as much as 97% as reported by Rademacher. In the studies performed in the Apiculture Division in the years 1988, 1990, 1992, 1995 and 1998 the percentage of light-coloured females in the natural fall averaged 32.5% (from 25% to 40.5%).
The amount of the natural fall of light-coloured females varied from year to year but the magnitude of that fall over the years- especially in the second part of the season from the beginning of July to mid-September – matched the year-to-year variation in infestation level expressed with the total number of dark and light-coloured females after chemical control treatments. Higly significant correlations were also found between the number of naturally dead light-coloured females and the number of dead dark and light-coloured females following chemical treatments (1988 = 0.652; 1990 = 0.768; 1992 = 0.893; 1995 = 0.718; 1998 = 0.899**). Each year of study is characterized by a different, peculiar rate of mite build up. The calculated differences between the autumn colony infestation thus estimated (expressed as the average predicted number of mites in colonies) and the actual mite fall after chemical treatments were characterized by substantial variation from – 362 to + 826 mites. Diurnal natural fall of light-bodied females calculated from shorter periods of counts cannot be treated as a reliable parameter to estimate the autumn infestation of bee colonies by the mite.
Keywords: Varroa jacobsoni, light female.
INTRODUCTION
According to Liebig and Schlupf (1983) the natural summer fall of Varroa jacobsoni allows a simple and a reasonably accurate prediction of the rate of infestation of bee colonies by the mite. However, based on her own
strona 186research Rademacher (1985) concluded that the natural mite mortality does not allow to predict the autumn colony infestation.
Alongside with dark-bodied females which die a natural death and fall to the bottom of the hive, males and developmental stages of the mite removed by the bees during cell cleaning the natural mite fall also contains light-bodied, non-coloured females which come out of the cells together with emerging adult insects but which do not survive (Le Conte and Arnold 1983; Steiner 1983). The magnitude of mite fall and the proportion of dark- and light-bodied females in the fall are closely related to brood emerging and to the kind of emerging brood. The proportion of light-bodied females in the mite fall varies and may reach 49, 70% (Liebig 1984) or even as high as 97% as reported by Rademacher (1985).
The objective of the study was to explain whether the number of light-bodied females in the natural summer mite fall can be a useful parameter in the estimation (still before the last honey harvest) of the magnitude of bee colony infestation by the mite.
MATERIAL AND METHODS
The study was conducted in the years 1988, 1990, 1992, 1995 and 1998 in a stationary apiary of the Apiculture Division which comprised a total of 123 bee colonies of the Caucassian and Carniolan bees with naturally and artificially inseminated queens placed in Dadant hives. Each year new colonies in the same apiary were taken for observations.
Table 1 Schedule of counting the natural fall of V. jacobsoni females and formulas used for control treatments – Harmonogram obserwacji naturalnego osypu samic V. jacobsoni oraz preparaty użyte do zabiegów chemicznych
| Year / Rok | Number of colonies / Liczba rodzin | Start to check for natural fall – Termin rozpoczęcia kontroli osypu naturalnego | Finish to check for natural fall / Termin zakończenia kontroli osypu naturalnego | Varroa – killing agent applied (a.i.) / Zastosowany środek warroabójczy (s.a.) |
|---|---|---|---|---|
| 1988 | 22 | 3.05 | 22.09 | 5 x Apiwarol A + Mitac (amitraz) |
| 1990 | 21 | 3.07 | 13.09 | 4 x Apiwarol AS (amitraz) / 2 x Perizin (coumaphos) |
| 1992 | 24 | 3.05 | 29.09 | Fluwarol (fluvalinate) / 2 x Perizin (coumaphos) |
| 1995 | 26 | 3.05 | 14.09 | Apifos (bromfenvinphos) / 4 x Apiwarol AS (amitraz) |
| 1998 | 30 | 3.05 | 15.09 | Apifos (bromfenvinphos) |
The number of Varroa jacobsoni females in the natural mite fall was checked at one-week intervals. To this end wire net bottom inserts were used which prevented the bees from getting the mites outside the hive. At the end of the season, in order to measure the magnitude of colony infestation Varroa-kiling agents available in a given year were used and weekly counts were also made of dead V. jacobsoni females (Table 1).
In order to characterise the dynamics of the natural fall the mobile mean method was used to cover three-week periods and mite counts were converted to the diurnal fall. The method allowed to eliminate random variation of the values of diurnal natural fall of light-bodied V. jacobsoni females.
RESULTS AND DISCUSSION
The mean number of dead light-bodied females which fell to the wire net bottom inserts stayed at a similar level in May and in June over all years of the study. In July and in August the number of light females rose two- to sixfold compared to previous month’s figures which, according to research by Martin and Kemp (1997), Loob and Martin (1997), was brought about by intensive rearing of brood in that period (Table 2).
Table 2 Changes in mortality rate of light- bodied V. jacobsoni females in consecutive months – Zmiany śmiertelności samic jasnych Varroa jacobsoni w następujących po sobie miesiącach
| Year / Rok | Natural fall of light- bodied females (mean / colony) indiv. — Osyp naturalny samic jasnych (średnio / rodzinę) szt.: May – Maj | June – Czerwiec | July – Lipiec | August – Sierpień |
|---|---|---|---|---|
| 1988 | 6,81 | 1,73 | 15,1 | 90,8 |
| 1990 | – | – | 40,90 | 143,0 |
| 1992 | 2,04 | 3,25 | 14,46 | 21,88 |
| 1995 | 13,04 | 11,81 | 20,73 | 44,19 |
| 1998 | 0,83 | 0,60 | 0,77 | 2,46 |
Likewise, there was an increase in the number of V. jacobsoni females in the diurnal natural fall calculated from counts made in three-week periods (Fig.1). It was also found that the range between the minimum and the maximum counts of dead light females increased as the season progressed which was indicative not only of different colony infestation rates but also of an uneven build-up of the mite in bee colonies.
strona 188The percentage levels of dark- and light-bodied females in the natural fall show that light bodied females are consistently less numerous. The light bodies females in the fall accounted for 25% to 40.5% of the mite fall. In the mite fall resulting from chemical treatments the percentage of light females was very low which is obvious as the treatments were done late in the season.
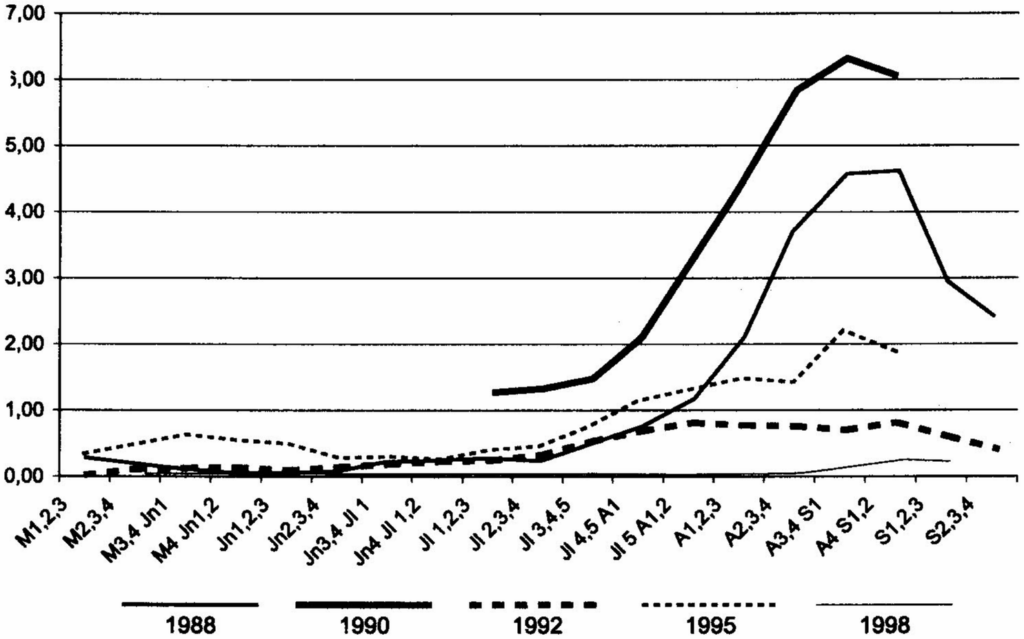
Despite a high variation among colonies for the magnitude of infestation by the mite within a year as assessed by the total number of light and dark females after chemical treatments statistical analysis showed the significance of differences between years with very high (1990), high (1988), medium-high (1995 and 1992) and low (1998) levels of Varroa incidence (Tab. 3). For the natural fall of light females year-to year statistically significant differences were found only in the second part of the season from July to September.
The analysis of the natural fall of light females allows to arrange the years in the same order (1990, 1988, 1995, 1992 and 1998) as they ranked according to the magnitude of infestation (Fig. 2). It indicates a relationship between the two traits. Such a conclusion is warranted by highly significant correlation coefficients between the natural summer fall of light females across the whole study period and in the L1 to W2 period and the total fall of dark and light females following chemical treatments (Table 4).
strona 189Table 3 Infestation of bee colonies based on the natural fall of mites and on the number of mites dead after chemical treatment – Porażenie rodzin pszczelich przez Varroa jacobsoni na podstawie naturalnego osypu samic pasożyta i osypu po zabiegach chemicznych
| Year / Rok | n | Natural mite fall — Osyp naturalny średnie (zakres) – szt.: from M1 – Jl4 / od M1 – C4 | from Jl1 – S2 / od C4 – S2 | total survey period / z całego okresu obserwacji | Total mite fall of dark female after chemical treatmens average (range) – Osyp po zabiegach chemicznych samic ciemnych średnie (zakres) – szt. | Total mite fall of light and dark females after chemical treatmens average (range) — Osyp po zabiegach chemicznych samic ciemnych i jasnych łącznie średnie (zakres) szt. |
|---|---|---|---|---|---|---|
| 1988 | 22 | 17,7 a | 163,9 ab | 196,9 a (26 – 583) | 1142,4 c (266 – 2461) | 1150,4 c (266 – 2463) |
| 1990 | 21 | – | 227,1 b | 227,1 * (43 – 648) | 1777,0 d (510 – 3220) | 1848,6 d (510 – 3350) |
| 1992 | 24 | 13,3 a | 48,9 a | 54,6 a (91 – 241) | 650,5 b (104 – 2276) | 652,7 b (104 – 2288) |
| 1995 | 26 | 36,7 a | 93,5 ab | 118,4 a (0 – 705) | 865,3 bc (125 – 2714) | 909,7 bc (146 – 2986) |
| 1998 | 30 | 2,2 a | 6,4 a | 7,9a (0 – 57) | 140,8 a (2 – 883) | 145,6 a (2 – 953) |
- – data not taken into consideration in the statistical analysis
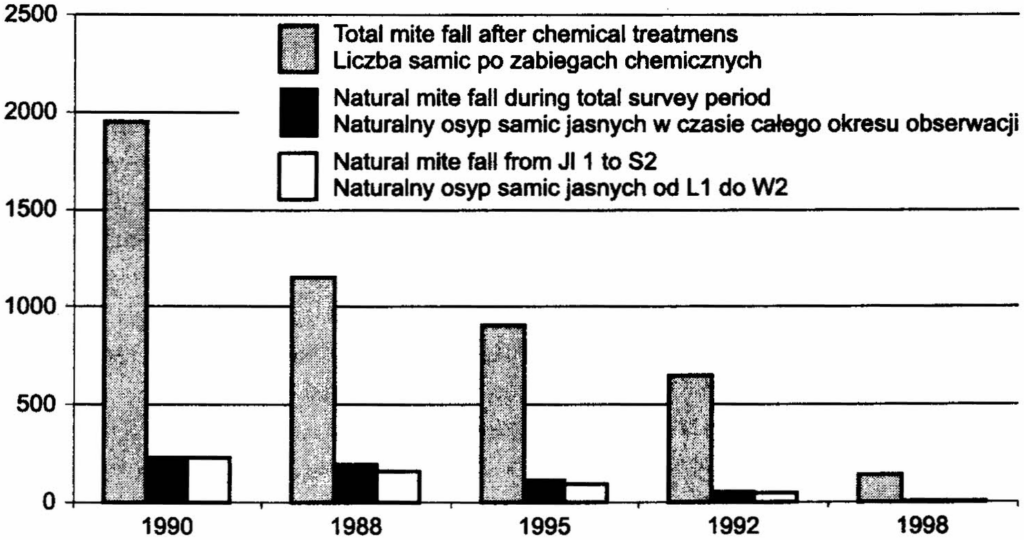
Table 4 Values of regression, correlation and determination coefficients for the natural fall of Varroa jacobsoni light-bodied females (x) vs. the fall light and dark-bodied females following chemical control (y). – Wartości współczynników regresji, korelacji i determinacji dla osypu naturalnego samic jasnych V. jacobsoni (x) względem osypu samic ciemnych i jasnych po zabiegach chemicznych (y)
| Year / Rok | Total surrey period / Cały okres obserwacji: b | a | r_xy | D | Period from Jl 1 to S2 / Okres od C1 do W2: b | a | r_xy | D |
|---|---|---|---|---|---|---|---|---|
| 1990 | – | – | – | – | 3,23 | 1113,8 | 0,768** | 59% |
| 1988 | 2,11 | 735,77 | 0,652** | 43% | 2,02 | 819,04 | 0,550* | 30% |
| 1995 | 3,69 | 537,09 | 0,718** | 52% | 4,03 | 578,09 | 0,704** | 50% |
| 1992 | 8,17 | 206,68 | 0,894** | 80% | 9,12 | 206,86 | 0,940** | 88% |
| 1998 | 17,01 | 11,79 | 0,889** | 79% | 19,84 | 18,03 | 0,902** | 81% |
b-regression coeff.; a-free term; r-correlation coeff.; D-determination coeff. ;* – significance level of 5% ; ** – significance level
b-wsp. regresji; a-wyraz wolny; r-wsp. korelacji; D-wsp. Determinacji; * – poziom istotności 5%; ** – poziom istotności 1%
The values of regression coefficients „a” and „b” calculated using linear regression and correlation method vary from year to year according to the magnitude of infestation in those years. The values of regression coefficients „b” (that predicts how great the increase of V. jacobsoni females after chemical treatment will be if the number of light females in the natural fall increases by 1 individual) are lower as the apiary infestation becomes higher. It indicates the presence of factors that check the build up of mites in the years with higher infestation (Tab. 4; Fig.3). However, the greater the infestation in a given year the lower the value of coefficient „a” – a regression equation constant.
In the second half of the season from Jl1 to S2 the calculated regression coefficient values „a” and „b” increased slightly but the tendency of their increase along with lower apiary infestation was not preserved (Table 4). It was due to atypical relationships in the years with higher infestation, especially in the year 1988. A substantial, as great as a 6-fold, increase in the number of light females in the natural fall in the period from Jl1 to S2 as compared to the increase in other years of the study points to an intensive mite propagation. The regression coefficient „b” in that year was the lowest indicating that consequent upon the increase of the natural fall by 1 female was a smaller number of mites after chemical treatments. Indeed, the fall of dark and light females after chemical treatments was the multiple by 7.0 in
strona 191that year and by 8.1 in 1990 of the respective falls of light females. Likewise, the values of correlation and determination coefficients in 1998 were lower than in the remaining years.
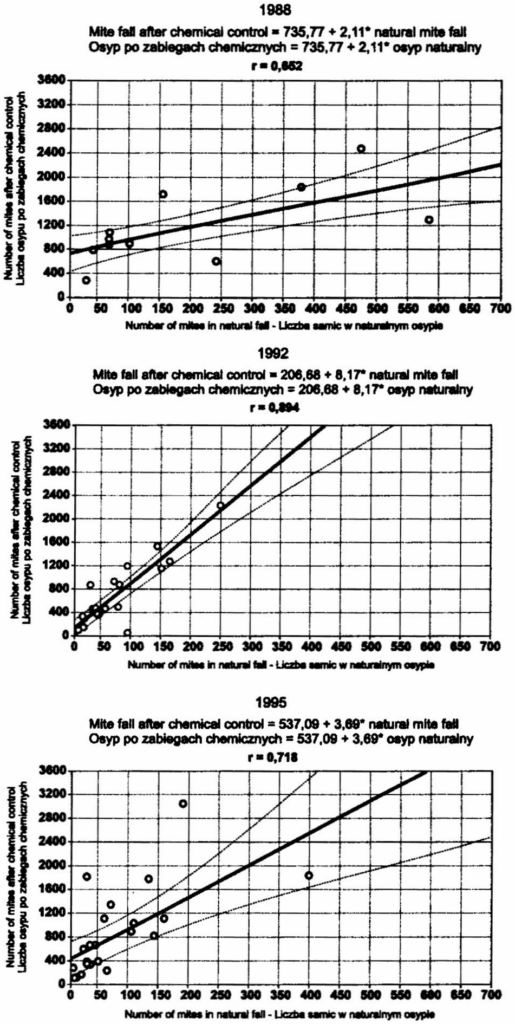
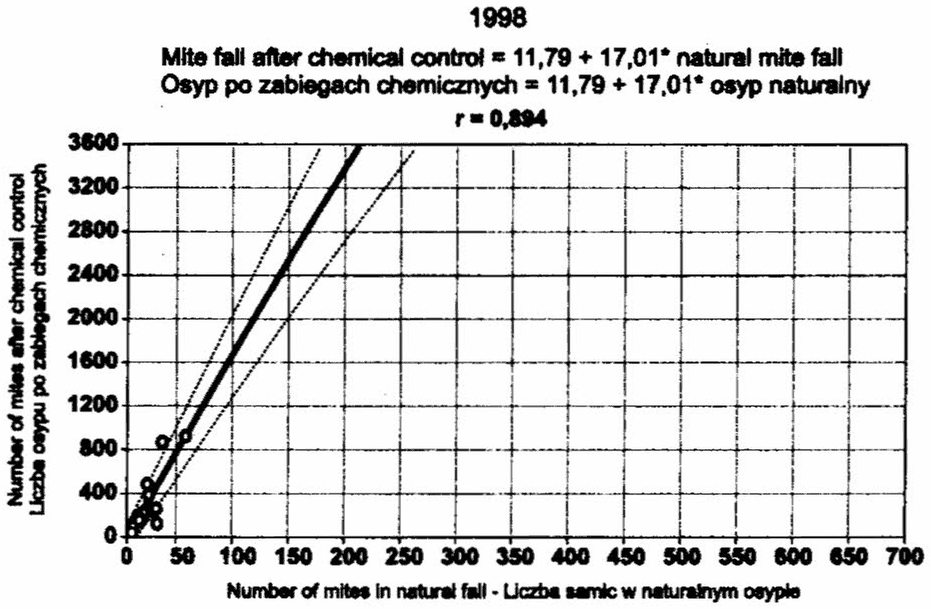
The relationships for the years with medium-high and low colony infestation followed a different pattern (1995, 1992, 1998). Regression coefficients „b” were much higher indicating that the increase in natural mite fall by 1 female caused higher increase in the number of mites towards the end of the season than that found in the high infestation years. The magnitude of mite fall after chemical treatments in those years was the multiple of respective natural falls by 9.6, 13.06 and 20.8. The values of correlation and determination coefficients were also higher than in 1988 and 1990 which indicates that in those years in 50% to 81% of cases the dependent variable was assignable to the independent variable.
The autumn infestation of bee colonies based on the magnitude of natural fall for the whole survey period was estimated using the regression equation common to the years of study in which counts were made in bottom inserts over the period from L1 to W2.
The data listed in Table 5 show a good agreement between the mean estimated and actual values for the years 1988, 1992 and 1995. The estimated mean autumn colony infestation by the mites was nearly the same as actual infestation, the differences being from 3.4 to 38%. The low infestation year 1998 was an exception – the estimated value (516 mites) was more than 3 times higher than the actual figure (146 mites) which was 253%.
The counts of the natural mite fall during the whole season or its large part would be difficult to do in commercial apiaries. Moreover, the clues obtained as to the necessity of chemical treatments could be not timely enough. Consequently, the regression analysis (common to all years of the study) was also extended to include the mobile mean of the natural fall obtained from counts of the natural fall of V. jacobsoni females for the second half of the season (from Jl1 to S2) made in three-week periods.
strona 193Table 5 Estimated autumn infestation of colonies by Varroa jacobsoni females (C) based on the natural fall of light bodied females (A) as calculated from the regression equation common to the years of study in which survey was done from July (Jl 1) to September (S2) – Szacowane jesienne porażenie pasiek przez samice V. jacobsoni (ciemne i jasne) (C) na podstawie naturalnego letniego osypu samic jasnych (A) według równania regresji wspólnego dla lat badań, w których obserwacje prowadzono w okresie od lipca (L1) do września (W2)
| Year / Rok | A: Mean natural fall (range) – Średni osyp naturalny samic jasnych (zakres) | B: Actual mean fall of females folloving autumn control (range) – Rzeczywisty średni osyp samic ciemnych i jasnych po jesiennych zabiegach chemicznych (zakres) | C: Estimated autumn infestation calculated by regression equation – Szacowane jesienne porażenie (samic ciemnych i jasnych) na podstawie letniego naturalnego osypu samic jasnych według równania regresji y = 490,22+3,69 x nat.fall r = 0,740; D = 55% | Difference between B and C / Różnica między B i C (%) |
|---|---|---|---|---|
| 1990 | 227 (43 – 648) | 1847 (510 – 3350) | 1328 (649 – 2888) | +28%* (-27 – 14) |
| 1988 | 164 (26 – 583) | 1150 (260 – 2463) | 1095 (550 – 2641) | +5% (-111 – 0.08) |
| 1995 | 94 (0 – 634) | 910 (146 – 2986) | 837 (490 – 2830) | +8% (-236 – 5,2) |
| 1992 | 50 (1 – 224) | 653 (104 – 2288) | 675 (494 – 1317) | -3,4%** (-375 – 42) |
| 1998 | 7 (0 – 47) | 146 (2 – 953) | 516 (498 – 664) | -253% |
- – signifies estimated autumn infestation higher than the actual mite fall after chemical treatments
- ** + signifies estimated autumn infestation lower than the actual mite fall after chemical treatments
- – – oznacza przewidywane jesienne porażenie rodzin wyższe od rzeczywistego osypu pasożytów po zabiegach chemicznych
** – + oznacza przewidywane jesienne porażernie rodzin niższe od rzeczywiste go osypu pasożytów po zabiegach chemicznych .
Once the correlation coefficients between the diurnal natural fall of light females and the autumn infestation of colonies were compared it was found that until mid-June the majority of coefficients were low whereas later on significant and highly significant coefficients prevailed (Table 6).
Unfortunately, not too high correlation and determination coefficients suggest that the summer diurnal natural fall cannot provide a basis for predicting the autumn infestation of bee colonies. The strength of the relationship is lower (Table 6) than when natural fall from the whole survey period or from Jl1 to S2 period is taken into account.
strona 194Table 6 Values of correlation coefficients expressing the relationship between the number of light- and dark- bodied V. jacobsoni females following chemical treatment and the number of light- bodied V. jacobsoni females in the natural mite fall countsfrom the 3- week periods – Wartości współczynników korelacji liniowej dla zależności pomiędzy liczbą samic ciemnych i jasnych V. jacobsoni w osypie po zabiegach chemicznych a liczbą samic jasnych V. jacobsoni w osypie naturalnym wyliczonym z okresów 3- tygodniowych
| Date / Okres | Years of study – Lata badań: 1988 | 1990 | 1992 | 1995 | 1998 |
|---|---|---|---|---|---|
| M1,2,3 | 0,678** | 0,125 | 0,486* | 0,485** | |
| M2,3,4 | 0,685** | -0,229 | 0,320 | 0,276 | |
| M3,4Jn1 | 0,698** | -0,136 | 0,288 | 0,245 | |
| M4Jn1,2 | 0,691** | -0,097 | 0,298 | 0,432** | |
| Jn1,2,3 | 0,844** | 0,478** | 0,395* | 0,353 | |
| Jn 2,3 | 0,914** | 0,265 | 0,570** | 0,404* | |
| Jn 3,4Jl1 | 0,872** | 0,485** | 0,614** | 0,110 | |
| Jn4Jl1,2 | 0,777** | 0,645** | 0,511** | 0,246 | |
| Jl1,2,3 | 0,778** | 0,186 | 0,749** | 0,460* | 0,348 |
| Jl2,3,4 | 0,751** | 0,096 | 0,776** | 0,384 | 0,587** |
| Jl3,4,5 | 0,658** | 0,144 | 0,743* | 0,590** | 0,572** |
| Jl4,5A1 | 0,556** | 0,344 | 0,801** | 0,631** | 0,592** |
| Jl5A1,2 | 0,525* | 0,381 | 0,838** | 0,643** | 0,160 |
| A1,2,3 | 0,619** | 0,439* | 0,727** | 0,652** | 0,695** |
| A2,3,4 | 0,597** | 0,523** | 0,641** | 0,640** | 0,882** |
| A3,4S1 | 0,609** | 0,574** | 0,653** | 0,665** | 0,923** |
| A4S1,2 | 0,581** | 0,562** | 0,630** | 0,715** | 0,932** |
M- May; Jn- June; Jl – Juli A- August; S-September; 1, 2, 3, 4, 5 – succeeding weeks
- – significante level of 5% ; ** – significante level
- – poziom istotności 5%; ** – poziom istotności 1%
Based on the summer diurnal natural fall of light females calculated from the three-week count periods and on the regression equations a prediction chart was drawn up. The chart lists predicted autumn infestations of bee colonies (number of mites) against mean diurnal natural falls over different count periods of 1,3,3………12 light V. jacobsoni females (Tab.7).
strona 195Table 7 Estimated autumn infestation of bee colonies by V. jacobsoni based on summer diurnal natural mite fall counts from 3 – week periods and calculation from regession equations common to all study years as shovn in foregoing table – Szacowane jesienne porażenie rodzin pszczelich przez V. jacobsoni na podstawie dobowego letniego osypu naturalnego pasożyta wyliczonego z okresów trzytygodniowych, obliczone według wspólnych dla wszystkich lat badań równań regresji
| Study period / Okres badań | Estimated number of V. jacobsoni females present in colonies with diurnal natural fall of: / Przewidywana liczba samic Varroa jacobsoni ciemnych i jasnych obecnych w rodzinach: 1 | 2 | 3 | 4 | 5 | 6 | 7 | 8 | 9 | 10 |
|---|---|---|---|---|---|---|---|---|---|---|
| Jn 4 Jl 1,2 | 1989 | 3560 | 5132 | 6704 | 8275 | 9523 | 11035 | 12990 | 14562 | 16133 |
| Jl 1,2,3 | 1480 | 2488 | 3496 | 4505 | 5513 | 6521 | 7529 | 8537 | 9546 | 10553 |
| Jl 2,3,4 | 1309 | 2130 | 2951 | 3773 | 4594 | 5415 | 6236 | 7057 | 7879 | 8700 |
| Jl 3,4,5 | 929 | 1356 | 1782 | 2208 | 2635 | 3061 | 3487 | 3914 | 4340 | 4766 |
| Jl 4,5 A1 | 929 | 1043 | 1311 | 1579 | 1847 | 2115 | 2383 | 2651 | 2919 | 3187 |
| Jl 5A 1,2 | 725 | 963 | 1200 | 1438 | 1675 | 1913 | 2150 | 2387 | 2625 | 2863 |
| A 1,2,3 | 667 | 899 | 1130 | 1361 | 1592 | 1823 | 2054 | 2285 | 2516 | 2747 |
| A 2,3,4 | 614 | 756 | 898 | 1040 | 1183 | 1325 | 1467 | 1609 | 1751 | 1893 |
| A 3,4 S1 | 572 | 700 | 830 | 959 | 1088 | 1217 | 1346 | 1475 | 1604 | 1733 |
| A4 S1,2 | 566 | 705 | 844 | 983 | 1121 | 1260 | 1399 | 1538 | 1676 | 1815 |
Jn- June; Jl – Juli A- August; S-September; 1, 2, 3, 4, 5 – succeeding weeks
Jn-czerwiec; Jl-lipiec; A-sierpień; S-wrzesień; 1,2,3,4,5- kolejne tygodnie miesiąca
The predicted figures of autumn colony infestation thus calculated are burdened with error. As was found earlier each year of study is characterised by a different, peculiar rate of mite build up. That is why regression equations calculated separately for each year and even for each count period differ from one another. The calculated differences between the autumn colony infestation thus estimated (expressed as the average predicted number of mites in colonies) and the actual mite fall after chemical treatments were characterized by substantial variation from – 362 to + 826 mites (Table 8). In the majority of cases the estimated autumn infestation was lower than the actual infestation. It indicates that the diurnal fall of light-bodied females calculated from shorter periods cannot be treated in its own right as a reliable parameter to estimate the autumn infestation of bee colonies by the mite.
strona 196Table 8 Difference between the estimated autumn infestation of colonies by light and dark- bodied V. jacobsoni females and the actual mite fall following chemical treatment over the periods and years of study – Różnica między szacowanym (na podstawie średniego dobowego osypu naturalnego samic jasnych) jesiennym porażeniem pasiek przez samice V. jacobsoni ciemne i jasne a rzeczywistym osypem po zabiegach chemicznych w poszczególnych terminach i latach badań
| Study period / Okres badań | Year of study – Rok badań: 1990 | 1988 | 1995 | 1992 | 1998 |
|---|---|---|---|---|---|
| Jn4 Jl 1,2 | +431 | +37 | -110 | -302 | |
| Jl 1,2,3 | +359 | +396 | +25 | -51 | -356 |
| Jl 2,3,4 | +482 | +449 | +36 | -98 | -358 |
| Jl 3,4,5 | +826 | +434 | +82 | -80 | -361 |
| Jl 4,5 A1 | +838 | +437 | +81 | -44 | -362 |
| Jl 5 A1,2 | +611 | +374 | +104 | -30 | -343 |
| A 1,2,3 | +384 | +203 | +120 | +34 | -292 |
| A 2,3,4 | +546 | +112 | +230 | +70 | -340 |
| A 3,4 S1 | +590 | +86 | +175 | +118 | -326 |
| A 4 S1,2 | +578 | +47 | +215 | +109 | -314 |
- – signifies estimated autumn infestation higher than the actual mite fall after chemical treatments
** + signifies estimated autumn infestation lower than the actual mite fall after chemical treatments
- – – oznacza przewidywane jesienne porażenie rodzin wyższe od rzeczywistego osypu pasożytów po zabiegach chemicznych
** – + oznacza przewidywane jesienne porażernie rodzin niższe od rzeczywiste go osypu pasożytów po zabiegach chemicznych .
CONCLUSIONS
- The mean number of dead light-bodied females which fell to the wire net bottom inserts stayed at a similar level in May and in June over all years of the study. In July and in August the number of light females rose two- to sixfold compared to previous month’s figures
- Likewise, there was an increase in the number of V. jacobsoni females in the diurnal natural fall calculated from counts made in three-week periods.
- The analysis of the natural fall of light females allows to arrange the years in the same order (1990, 1988, 1995, 1992 and 1998) as they were arranged according to the magnitude of infestation
- The majority of correlation coefficients between the diurnal natural fall of light females and the autumn infestation of colonies until mid-June
were low and insignificant whereas later on significant and highly significant coefficients prevailed
- Each year of study is characterised by a different, peculiar rate of mite build up
- The calculated differences between the autumn colony infestation thus estimated (expressed as the average predicted number of mites in colonies) and the actual mite fall after chemical treatments were characterized by substantial variation from – 362 to + 826 mites
- Diurnal natural fall of light-bodied females calculated from shorter periods of counts cannot be treated as a reliable parameter to estimate the autumn infestation of bee colonies by the mite.
REFERENCES
Le Conte Y., Arnold G. (1987)- Influence de l’age des abeilles (Apis mellifica L.)et de la chaleur sur le comportement de Varroa jacobsoni Oud. Apidologie 18(4): 305-320
Liebig G. (1994)- Entsehung und Zusammenfasung des natürlichen Milben(ab)falls. Dt. Bienen J. 2(3): 141-143
Liebig G., Schlupf U., Fremuth W., Ludwig W. (1984)- Ergebnisse der Untersuchungen über die Befallsentwicklung der Varroa – Milbe in Stuttgart – Hohenheim in 1983. ADIZ. 18(8): 185-191
Loob N., Martin S. (1997)- Mortality of Varroa jacobsoni Oudemans during or soon after the emergence of worker and drone honeybees Apis mellifera L. Apidologie 28(6): 367- 374
Martin S.J., Kemp D. (1997)- Average of reproductive cycles performed by Varroa jacobsoni in honey bee (Apis mellifera) colonies. J.apic.Res. 36(3/4): 113-123
Rademacher E. (1985)- Ist eine Befallsprognose aus dem natürlichen Totenfall von Varroa jacobsoni möglich? Apidologie 16(4): 395-406
Steiner J. (1993)- Verteilung von Varroa jacobsoni im Drohnenfreien Bienevolk. Apidologie 24(1): 45-50
SAMICE JASNE JAKO PARAMETR PRZYDATNY W OCENIE PORAŻENIA RODZIN PSZCZELICH PRZEZ PASOŻYTA VARROA JACOBSONI
Bieńkowska M., Konopacka Z.
Streszczenie
W osypie naturalnym obok samic ciemnych, które giną śmiercią naturalną i opadają na dno ula, samców i stadiów rozwojowych pasożyta usuwanych przez pszczoły podczas czyszczenia komórek, znajdują się również samice jasne, nie wybarwione wychodzące z
strona 198komórek wraz z wygryzającymi się dorosłymi owadami, ale niezdolne do życia. Poziom osypywania się pasożytów i udział w nim samic ciemnych i jasnych związany jest ściśle z wygryzaniem się jak również rodzajem wygryzającego się czerwiu.
Udział samic jasnych w osypie naturalnym bywa różny i może wynosić 49%, 70%, a w badaniach Rademacher nawet 97%. W badaniach prowadzonych w Oddziale Pszczelnictwa w latach 1988, 1990, 1992, 1995 i 1998r. procentowy udział samic jasnych w osypie naturalnym wynosił średnio 32,5% (od 25% do 40,5%). Liczba tych samic w maju i w czerwcu utrzymywała się na niskim niemal jednakowym poziomie (średnio około 7 samic/rodzinę/miesiąc/rok), gwałtownie wzrastała w lipcu (średnio około 21 samic/rodzinę/miesiąc/rok) i w sierpniu (średnio około 60 samic/rodzinę/miesiąc/rok), a we wrześniu spadała bardzo wyraźnie co miało niewątpliwie związek ze zmniejszaniem się ilości czerwiu w rodzinach.
Poszczególne lata badań różniły się między sobą wielkością osypu naturalnego samic jasnych, ale wielkość tego osypu – szczególnie w drugim okresie sezonu od początku lipca do połowy września – pozwalała na uszeregowanie lat w tej samej kolejności jak uszeregowanie lat według nasilenia inwazji wyrażonego liczbą samic ciemnych i jasnych razem po chemicznych zabiegach leczniczych. Stwierdzono również występowanie wysoko istotnych korelacji między liczbą samic jasnych w osypie naturalnym z całego okresu obserwacji i okresu od lipca do połowy września, a liczbą samic ciemnych i jasnych w osypie po chemicznych zabiegach leczniczych ( w 1988 r = 0,652; w 1990 r = 0,768; w 1992 r = 0,893; w 1995 r = 0,718 i w 1998 r = 0,889**). Posługując się równaniem regresji wspólnym dla wszystkich lat badań oszacowano jesienne porażenie rodzin pszczelich na podstawie wielkości osypu naturalnego samic jasnych z całego okresu obserwacji. Stwierdzono dużą zgodność między średnimi wielkościami szacowanymi a rzeczywistymi w latach 1988, 1992 i 1995. Wyjątek stanowił rok 1998 o skrajnie niskim porażeniu, w którym wartość szacowana była ponad 3-krotnie wyższa niż rzeczywista.
Obserwacje osypu naturalnego w ciągu całego sezonu byłyby trudne do zrealizowania w pasiekach produkcyjnych, dlatego analizę regresji wspólną dla wszystkich lat badań przeprowadzono dla dobowego osypu naturalnego wyliczonego z krótszych okresów obserwacji. Na tej podstawie opracowano tabelę prognostyczną, która podaje przewidywane jesienne porażenie rodzin pszczelich, gdy dobowy osyp wyliczony z trzytygodniowych okresów obserwacji wynosi 1, 2, 3,…….i 10 samic jasnych Varroa jacobsoni.
Obliczone różnice między tak szacowanym jesiennym porażeniem rodzin pszczelich a rzeczywistym osypem pasożytów po zabiegach chemicznych charakteryzowały bardzo duże wahania od -362 do +826 pasożytów. Świadczy to o tym, że dobowy osyp samic jasnych wyliczony z krótkich okresów obserwacji nie może być traktowany jako oddzielny, pojedynczy i wiarygodny parametr w szacowaniu porażenia rodzin pszczelich przez pasożyta.
Słowa kluczowe: Varroa jacobsoni, porażenie, samice jasne.
Errata — błędy druku znalezione podczas digitalizacji
- s. 185: „Higly” → Highly
- s. 186: „Caucassian” → Caucasian
- s. 187: „kiling” → killing
- s. 187, 197, 2×: „Loob” → Lobb
- s. 188: „light bodies females” → light-bodied females
- s. 189, tab. 3, ryc. 2, 3×: „treatmens” → treatments
- s. 190, tab. 4: „Total surrey period” → Total survey period
- s. 193, tab. 5: „folloving” → following
- s. 193, 196, tab. 5 i 8, 2×: „porażernie” → porażenie
- s. 193, 196, tab. 5 i 8, 2×: „rzeczywiste go” → rzeczywistego
- s. 194, tab. 6: „countsfrom” → counts from
- s. 194, tab. 6, 2×: „significante” → significance
- s. 195, tab. 7: „regession” → regression
- s. 195, tab. 7: „shovn” → shown
- s. 197, piśmiennictwo: „l’age” → l’âge
- s. 197, piśmiennictwo: „Entsehung” → Entstehung
- s. 197, piśmiennictwo: „Zusammenfasung” → Zusammenfassung
- s. 197, piśmiennictwo: „Bienevolk” → Bienenvolk