

NUMBER OF POLLINATOR INSECTS WITH REFERENCE TO SEED SETTING IN RED CLOVER IN DIFFERENT REGIONS OF POLAND
tekst: Stanisława Sowa, Andrzej Ruszkowski, Stanisław Bawolski, Mieczysław Biliński
Pszczelnicze Zeszyty Naukowe, Rok XXI, 1977 — Stanisława Sowa, Andrzej Ruszkowski, Stanisław Bawolski, Mieczysław Biliński
strona 219BEE RESEARCH COPIES VXXI DECEMBER 1977
Stanisława Sowa, Andrzej Ruszkowski, Stanisław Bawolski, Mieczysław Biliński
ART Olsztyn, IUNG and I.S. Puławy, Poland
Red clover, a plant exclusively entomophilous, produces too low a seed crop in Poland. The quantity of crop varies with years and is different in different regions of Poland. Therefore in 1972—1974 (and partly in 1975) the Institute of Soil Science and Cultivation of Plants, the Institute of Pomology Bee Department in Puławy, and the Agriculture-Technological Academy in Olsztyn undertook a series of investigations on the number and species composition of pollinator insects and on the yield components of red clover. Entomological studies were carried out on 467 plantations of the second crop, and the investigations on seed crop — on 793 plantations.
The number of pollinator insects was defined during walking along the strips 200 meters long and 1 m wide (in 1972: 250 m long) at the speed 6—7 m/min. The species composition was also determined in a non-selective hunting with a entomological net. The percentage of individuals of bumblebees and honeybees pollinating flowers was recorded and so was the percentage of the individuals which did not pollinate flowers, merely collecting nectar through the holes bitten on the corolla tube. The observations on one plantation lasted, as a rule, 30—60 minutes, and were made only on red clover in fool bloom and at the temperature at least 18°C.
To obtain a measure unit common for all pollinator insects, the value of pollination by each individual of bumblebees and solitary
strona 220bees was defined in terms of the effectiveness of an average honeybee. Such an average honeybee was called a „unitbee”. By the conversion Of number of bumblebees and solitary bees into the unitbees the following factors were taken into account: the speed of visitations of flowers, the lenght of daily work, the number of visitation days, the amount of seed obtained from 100 flowers visited and the percentage of pollinator individuals (Table 1).
Table 1 Conversion table of red clover pollinator insects (with reference to the average honeybee worker)
| Number of flowers visited per 1 hour | Number of hours of daily work | Number of visitation days during II crop flowering | Number of seed set per 100 flower visited | % of pollinator individuals | Coefficient¹ | ||
|---|---|---|---|---|---|---|---|
| Relative values — according to the honeybee effectiveness | |||||||
| Apis mellifera | ☿ average | 1 | 1 | 1 | 1 | 1 | 1 |
| ☿ pollinating | 1 | 1 | 1 | 1 | 2,8 | 2,8 | |
| Bombus terrestris + B. lucorum | ☿ average | 2,2 | 1,1 | 1 | 0,98 | 1,2 | 2,8 |
| ♂ | 1,6 | 1,1 | 1 | 0,93 | 2,8 | 3,9 | |
| X̄ (10,3 % ♂) | 2,9 | ||||||
| other species of Bombus | ☿ | 2,2 | 1,1 | 1 | 0,98 | 2,8 | 6,6 |
| ♂ | 1,6 | 1,1 | 1 | 0,93 | 2,8 | 4,6 | |
| X̄ (4,4 % ♂) | 6,5 | ||||||
| Andrena | [?] | 0,4 | 0,85 | 1 | 1,06 | 2,8 | 1,0 |
| Halictus | ♀ | 1,0 * | 0,8 | 1 | 1 ? | 2,8 | 2,2 |
| Rhophitoides canus | [?] | 1,5 * | 0,8 ? | 1 | 1 ? | 2,8 | 3,3 |
| Psithyrus | X̄ ([?] + ♂) | 1,6 * | 0,8 | 1 | 0,93 ? | 2,8 | 3,3 |
| Anthophora | ♀ | 1,5 * | 0,9 | 1 | 1 ? | 2,8 | 3,7 |
| Eucera | ♀ | 2,8 * | 0,85 | 0,77 | 1 ? | 2,8 | 5,1 |
| Melitta leporina | ♀ | 2,4 * | 0,9 | 1 | 1 ? | 2,8 | 6,0 |
| Amegilla quadrifasciata | ♀ | 3,0 * | 0,8 ? | 1 | 1 ? | 2,8 | 6,7 |
| Megachile | ♀ | 3,0 * | 0,9 | 1 | 1 ? | 2,8 | 7,5 |
| Melitturga clavicornis | ♀ | 4,1 * | 0,9 | 1 | 1 ? | 2,8 | 10,3 |
| Colletes | ♀ | — | — | — | — | — | 1,0 ? |
| Dasypoda | ♀ | — | — | — | — | — | 4,0 ? |
| Absolute values | |||||||
| Apis mellifera | ☿ average | 717 | 10 | the whole period | 83,6 | 35% | 1 |
Notes: ¹ One individual of a given species corresponds to the number of „unitbees” presented below.
Remarks: Estimated figures are provided with question marks and figures based on observations of visitation of lucerne — with asterisks. This table is based on observations presented in the works by Jabłoński (1975), Biliński (1977), Dylewska et al. (1970a). Ruszkowski et al. (1975), Anasiewicz (1975).
strona 221The quantity of seed set per 1 m² was defined for each plantation by multiplying the number of flower heads per 1 m² (the average number obtained from 6 squares of ground, 1 m² each, chosen at random) by the number of seeds per 1 head (the average number obtained from 50 heads). Bearing in mind the number of seeds set, the weight of 1000 seeds (amounting, on an average, to 1,7 g in more favourable regions of Poland) and the percentage of offal (reaching on average 32% for Poland), the real seed crop was defined (Table 3 and Map 3). 1000 seeds per 1 m² corresponded here to 11,56 kg of the real crop/ha. Next the expected average seed yield was determined by subtracting the average seed loss (60%). The crop reaped, then, constituted only 40% of the real crop, that is 1000 seeds per 1 m² corresponded here to 4,62 kg/ha.
We also tried to reduce to a common denominator the number of pollinator insects and the quantity of the seed crop to get a synthetic picture of conditions for pollination (Map 4). Dividing the average crop reaped (210 kg/ha) by the average number of „unitbees” (10500/ha) we stated that 1000 „unitbees” fall to 20 kg of seed. In this way we succeeded in determining the number of bees in terms of the expected seed quantity, which made it possible for us to compare the number of pollinator insects (Maps 1 and 2) with the number of seeds set (Map 3).
The number of pollinator insects per 1 ha of red clover was subject to a considerable variation, reaching in some cases: 25000 honeybees, 24000 bumblebees or 1100 solitary bees, and often was equal to 0. As Table 2 shows, honeybees were greatest in number (on average 65%), the number of bumblebees was smaller by half (33%) and that of other bees (mainly Andrena) — very small (below 2%). 1972 saw the greatest number of honeybees, whereas 1973 and 1975 the greatest amount of bumblebees.
In the pollination of red clover one bumblebee individual corresponds however (according to a species) to 2,8—6,5 average honeybees (Table 1). On an average only 35% of honeybees visiting red clover pollinate this plant, meanwhile 43% of Bombus terrestris workers and nearly 100% of the other bumblebees and solitary bees pollinate red clover. That is why the proportion of bumblebees in red clover pollination is considerably higher than their percentage in visitation of flowers, and it amounts to 71%. The proportion of honeybees in the pollination reaches 27%. The corresponding figures for Bombus terrestris and B. lucorum (23%) do not essentially vary from that of the honeybee though one used to consider effect of these bumblebees on red clover as harmful.
If we divide the provinces into groups with reference to the average quantity of seed set (Table 3), we can observe that an increase in seed crop goes hand in hand with an increase in the number of bumblebees
strona 222and honeybees. No correlation was found however between seed yield and the amount of other bees.
In regions, where the number of bumblebees and honeybees is insufficient, red clover seed yields must needs be low. In some regions, however, (e.g. group 0 in Table 3) in spite of a great amount of pollinator insects, the yields were very low, which was undoubtedly caused by other factors (e.g. meteorological).
The total number of pollinators (defined by the number of „unitbees”) was biggest in South-Western, Western and North-Eastern Poland (Map 1) so in these regions it should, theoretically, ensure a profitable seed yield. This general picture holds true also for wild Apoidea alone, without honeybee (Map 2), though regions pollinated sufficiently are constantly becoming smaller, and the height of the expected seed yield is getting lower. This proves that the number of bumblebees is principally
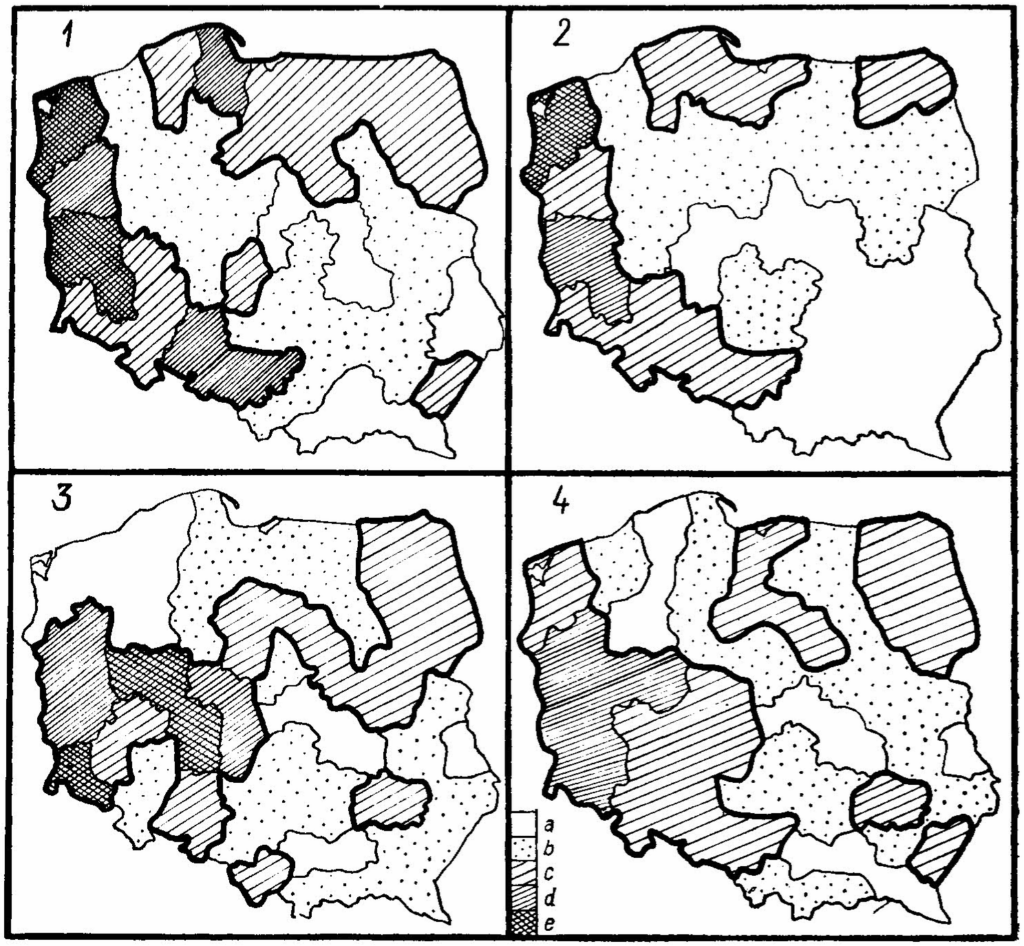
Regions with good and poor red clover pollination
- Global number of pollinator insects in 1972—1975
- Number of pollinator insects without honeybee
- Number of seed set and seed crop
- Regions of godd pollination
| Number of unitbees/ha | Number of seed/m² | Seed crop in q/ha: Real crop | Seed crop in q/ha: Expected crop reaped | |
|---|---|---|---|---|
| a | 0—5000 | 0—22000 | 0—2,5 | 0—1,0 |
| b | 5100—10000 | 23000—44000 | 2,6—5,0 | 1,1—2,0 |
| c | 10100—15000 | 45000—66000 | 5,1—7,5 | 2,1—3,0 |
| d | 15100—20000 | 67000—88000 | 7,6—10,0 | 3,1—4,0 |
| e | 20100— | 89000— | 10,1— | 4,1— |
1000 unitbees/ha = 0,5 q of real crop = 0,2 q of average reaped crop 1000 seeds/m² = 0,116 q of real crop per 1 ha = 0,046 q of reaped crop per 1 ha
responsible for areas well pollinated, though honeybees contribute to the increase in seed yields too (on average in 27%).
The regions with good seed setting (Map 3) were in fact those which exhibit a great number of pollinators (Map 1), notable exceptions
Table 2 Number and percentage of pollinator insects visiting red clover in Poland in 1972—1975
| 1972 | 1973 | 1974 | 1975¹ | x̄ 1972—1974 | Percentage of insects: in³ pollination | |
|---|---|---|---|---|---|---|
| Number of insects per 1 ha | ||||||
| Apis mellifera | 4100 | 3300 | 1700 | 3800 | 2840 | |
| Bombus terrestris + + B. lucorum | 500 | 1000 | 700 | 1300 | 760 | |
| Other bumblebees | 700 | 900 | 600 | 1900 | 730 | |
| Other Apoidea | 86 | 77 | 81 | 125 | 81 | |
| Percentage of insects: in visitation of flowers² | ||||||
| Apis mellifera | 77,2 | 63,1 | 56,3 | 53,6 | 65,2 | 27,7 |
| Bombus terrestris + + B. lucorum | 8,8 | 18,6 | 22,1 | 18,2 | 16,8 | 22,1 |
| Other bumblebees | 12,4 | 16,8 | 18,9 | 26,5 | 16,2 | 48,6 |
| Other Apoidea | 1,6 | 1,5 | 2,7 | 1,7 | 1,8 | 1,6 |
| Percentage of other Apoidea² | |
|---|---|
| Andrena | 74,7 |
| Melitta | 10,6 |
| Eucera | 5,5 |
| Halictus | 3,3 |
| Psithyrus | 2,9 |
| Megachile | 0,9 |
| Melitturga | 0,6 |
| Anthophora | 0,5 |
| Rhophitoides | 0,5 |
| Dasypoda | 0,3 |
| Amegilla | 0,1 |
| Colletes | 0,1 |
Notes: ¹ In 1975 investigations were carried out in 10 provinces ² According to observations ³ Conversion done according to Table 1
strona 224Table 3 Number of pollinator insects and red clover seed setting in Poland in 1972—1974 (provinces are divided into groups according to average number of seed set per 1 m²)
| Group of provinces | Number of investigated: provinces | Number of investigated: plantations: for insects | Number of investigated: plantations: for seed set | Number of pollinator insects in hundreds: honeybees | Number of pollinator insects in hundreds: bumblebees | Number of pollinator insects in hundreds: other Apoidea | Number of pollinator insects in hundreds: total: f + g | Number of pollinator insects in hundreds: total: h + e | Seed setting: Number of seeds in thousands per 1m² | Seed setting: Real crop q/ha¹ | Number of insects with reference to seed crop |
|---|---|---|---|---|---|---|---|---|---|---|---|
| a | b | c | d | e | f | g | h | i | j | k | |
| 0 | 3 | 12 | — | 23 | 19 | 0,1 | 19 | 42 | — | — | |
| I | 5 | 24 | 29 | 14 | 8 | 0,8 | 9 | 23 | 15 | 1,8 | |
| II | 16 | 168 | 310 | 26 | 11 | 0,7 | 12 | 38 | 29 | 3,3 | |
| III | 15 | 185 | 335 | 32 | 18 | 1,0 | 19 | 51 | 54 | 6,2 | |
| IV | 9 | 79 | 119 | 32 | 21 | 0,7 | 22 | 54 | 77 | 8,9 | |
| 48 | 467 | 793 | x̄ : 29 | 16 | 0,8 | 17 | 46 | 46 | 5,3 |
| In relation to honeybee: l | In relation to honeybee: m | In relation to honeybee: n | In relation to honeybee: o | In relation to honeybee: p | Average crop reaped in q/ha²: r³ | Average crop reaped in q/ha²: s⁴ | Average crop reaped in q/ha²: t⁵ | |||||
|---|---|---|---|---|---|---|---|---|---|---|---|---|
| I | — | — | — | 14 | 38 | 1,5 | 40 | 54 | — | 0,7 | 1,1 | 0,8 |
| II | — | — | — | 26 | 56 | 1,4 | 58 | 84 | — | 1,3 | 1,7 | 1,5 |
| III | — | — | — | 32 | 84 | 2,3 | 86 | 118 | — | 2,5 | 2,4 | 2,4 |
| IV | — | — | — | 32 | 95 | 1,3 | 96 | 128 | — | 3,6 | 2,6 | 3,1 |
| x̄ : | — | — | — | 29 | 74 | 1,7 | 76 | 105 | — | 2,1 | 2,1 | 2,1 |
In comparison with group I
| I | — | — | — | 100 | 100 | 100 | 100 | 100 | 100 | 100 | 100 | 100 |
| II | — | — | — | 186 | 147 | 93 | 145 | 156 | 189 | 189 | 156 | 187 |
| III | — | — | — | 229 | 221 | 153 | 215 | 219 | 355 | 355 | 219 | 287 |
| IV | — | — | — | 229 | 250 | 87 | 240 | 237 | 507 | 507 | 237 | 387 |
Notes: ¹ k = j · seed weight — % of offal; k = (j · 0,1156) q ² It is an average seed yield, which can be obtained at average percentage of offal (32%) at the weight of 1000 seeds reaching 1,7 g and at 60% loss of crop during harvesting. ³ r = k — loss in crop during harvesting; r = k · 0,4 ⁴ s = p · 0,02 q; since x̄r : x̄p = 2,1 q : 105 = 0,02 q ⁵ t = (r · d + s · c) : (d + c)
strona 226being Northern Poland, where the seed crop was small in spite a great amount of pollinators and some western provinces (e.g. Poznań and Kalisz), where the reverse held true. In these western provinces, however, relatively few plantations were examined, but in Northern Poland often unfavourable weather conditions hamper the process of seed maturing.
The number of honeybees, sufficient to ensure a profitable seed crop, was obtained only in Przemyśl province in 1972 and 1974. However, the actual number of seed was small in this province (Map 3). A possibility of obtaining a high red clover seed yield thanks to the honeybees only seems doubtful then.
After reducing to a common denominator the number of pollinator insects and the quantity of seed set, one can distinguish the regions with red clover well pollinated. As Map 4 shows, these are mainly the south-western provinces, covering the area demarcated by Szczecin—Konin—Katowice. This region can be further subdivided into an area covering 5 western provinces characterized by an optimum insect pollination. There are also two smaller regions well pollinated: the north-eastern region and the region of lower Vistula, and the islets in South-Eastern Poland.
If the two things only: the number of pollinators and seed setting were taken into account, one would be led to the conclusion that the cultivation of red clover seed should be localized mainly in South-Western Poland.
Summing up:
- Red clover seed setting and the number of pollinator insects are visibly correlated.
- The main proportion in the pollination of this plant in Poland falls to bumblebees (on an average 71%), the contribution of the honeybees being smaller (27%).
- The quick undertaking of an intensive and effective protection of bumblebees is indispensable.
- The best conditions for pollination of red clover exist in Western and South-Western Poland.
- The method applied in the entomological studies appeared to be sufficiently exact to obtain the approximate and indicatory data on pollination conditions in different regions.
LITERATURE
Anasiewicz A. (1975) — The bees (Apoidea) on alfalfa (Medicago media Pers.) plantations. I. The species composition and variation of flights. Ekol., pol., 23 (1): 129—146.
Bawolski S., Szeleźniak E., Wiejak H. (1974) — Height and components
strona 227of the real seed yields of red clover in different regions of Poland. Wstępne wyniki badań nad nasiennictwem koniczyny czerwonej. IUNG. Puławy. (Polish).
Biliński M. 1977 — Visiting of red clover by pollinating insects. Pol. Pismo entomol. 47: 487—505.
Dylewska M., Jabłoński B., Sowa S., Biliński M., Wrona S. (1970a). An attempt of determination of the number of bees (Hym., Apoidea) needed for adequate pollination of alfalfa. Pol. Pismo entomol., 40 (2): 371—398.
Dylewska M., Ruszkowski A., Jabłoński B., Biliński M., Sowa S., Wrona S. (1970b) — Studies on methods of determining numbers of pollinating insects on seed alfalfa plantations. Wiad. ekol., 16 (3): 232—244.
Jabłoński B. (1975) — Density of Apoidea necessary for good pollination of red clover. Pszczeln. Zesz. nauk., 19: 1—29.
Ruszkowski A., Jabłoński B., Biliński M., Krawczyk J., Kuna K., Cybula A. (1975) — The search for the methods to increase population of insects pollinating alfalfa. Second Annual Report, Puławy.
Sowa S., Ruszkowski A., Biliński M., Kosior A. (1974) — Number and species composition of insects pollinating red clover in some regions of Poland in 1972 and 1973. Wstępne wyniki badań nad nasiennictwem koniczyny czerwonej. IUNG. Puławy. (Polish).
LICZEBNOŚĆ OWADÓW ZAPYLAJĄCYCH A ZAWIĄZYWANIE NASION KONICZYNY CZERWONEJ W RÓŻNYCH REJONACH POLSKI
Stanisława Sowa, Andrzej Ruszkowski, Stanisław Bawolski i Mieczysław Biliński, Puławy, Polska
Streszczenie
W latach 1972—75 na terenie 48 województw przeprowadzono zespołowe badania (IUNG, IS oraz ART—Olsztyn) nad liczebnością i składem gatunkowym owadów zapylających koniczynę czerwoną II pokosu, oraz nad strukturą plonu nasion. Owady zbadano na 467 polach (metodą „przemarszu”, nieselektywnego odłowu, oraz liczenia procentu osobników zapylających), a strukturę plonu na 793 polach. Wszystkie owady zapylające przeliczano na przeciętną pszczołę miodną (czyli „pszczołę przeliczeniową”), uzyskując dla każdej plantacji ogólny wskaźnik liczebności zapylaczy na 1 ha. Dzieląc średni dla Polski przewidywany plon zbierany nasion przez średnią dla Polski liczebność „pszczół przeliczeniowych” ustaliliśmy, że 1000 pszczół przeliczeniowych odpowiada 0,2 q nasion. Przez to zagęszczenie zapylaczy stało się porównywalne z plonem nasion.
Zastosowana (stosunkowo prosta) metoda badań entomologicznych dała orientacyjne dane o warunkach zapylania w poszczególnych rejonach. Głównymi zapylaczami okazały się trzmiele (w 71%), przy mniejszym udziale pszczoły miodnej (28%). Plon nasion jest wyraźnie skorelowany z liczebnością zapylaczy. Najwięcej trzmieli (i w ogóle „pszczół przeliczeniowych”) i najwyższe plony nasion występują w Polsce południowo-zachodniej i zachodniej, a w słabszym stopniu także i w północno-wschodniej. W pozostałych rejonach liczebność zapylaczy jest na ogół zbyt niska dla uzyskania opłacalnych plonów nasion. Konieczne jest więc szybkie podjęcie skutecznej ochrony trzmieli.
Errata — błędy druku znalezione podczas digitalizacji
- s. 219: „fool bloom” → full bloom
- s. 220: „lenght” → length
- s. 223: „godd” → good