

THEORETICAL STUDIES ON THE EFFECT OF THE NUMBER OF SEX ALLELES IN HONEYBEE POPULATIONS AND THE NUMBER OF MATINGS ON THE FREQUENCY DISTRIBUTION OF QUEENS PRODUCING BROOD OF DIFFERENT SURVIVAL RATE
tekst: Jerzy Woyke
Pszczelnicze Zeszyty Naukowe, Rok XL, 1996 — Jerzy Woyke
strona 115PSZCZELNICZE ZESZYTY NAUKOWE Rok XL, Nr 1 1996
Jerzy Woyke
Bee Division, Agricultural University – SGGW, Nowoursynowska 166, 02-787 Warszawa, POLAND
Summary
The survival rate of brood produced by particular queens depends upon the number of sex alleles (N) in honeybee population and the number of matings (k). The binomial frequency distribution of queen bees producing brood of different survival rate is: Q = [2/N + (N-2)/N]^k. With constant number of matings (k = 8), the number of queen classes whose frequency is > 0.1 decreases with the increase of the number of sex alleles, from 7 ( for N = 3 sex alleles) to 4 (N = 25). Frequency of queens producing brood of 100% survival rate increases from 0.014% (N = 3) to 23% (N = 12) and to 85% (N = 100). With constant number of sex alleles N = 12, the number of queen classes whose frequency is ≥ 0.1 increases with the increase of the number of matings, from 2 (k = 1 mating) to 5 (k = 8) and 10 (k = 25). Frequency of queens producing brood of 100% survival rate decreases from 85% (k = 1) to 23% (k = 8) and to 1% (k = 25).
Keywords: queen honeybee, distribution, sex alleles, brood survival, number of matings.
INTRODUCTION
M a c k e n s e n (1951) showed the existence of a series of haploviable however, homozygous lethal alleles in honeybee. W o y k e (1962) proved, that eggs homozygous at sex locus are viable. Diploid drone larvae hatch from them (Woyke 1963a), however, they are eaten by worker bees shortly after being hatched (W o y k e 1963b). A method of rearing diploid drones to adults was worked out (W o y k e 1969). Up to 50% eggs, homozygous at sex locus may appear. Due to eating of diploid drone larvae, scattered brood appears in bee colonies. S z a s k o l s k i j (1968) studied some aspects of frequency distribution of queens producing brood of different survival rate. W o y k e (1972) presented sex allele combinations and frequencies of queens producing brood surviving in different percentage, as a result of different controlled matings. Population genetic studies on sex alleles in honeybee was started by W o y k e (1976), and continued by Y o k o y a m a and N e i (1979). P a g e and L a i d l a w (1982)
strona 116continued to study this question in closed population of honeybee.
Colonies producing higher percentage of eggs homozygous at sex locus are weak (W o y k e 1980, 1981). Therefore, it is important to forecast the survival rate of brood produced by different queens. The survival of brood produced by particular queens depends upon the number of sex alleles (N) in honeybee population and the number of matings (k).
RESULTS AND DISCUSSION
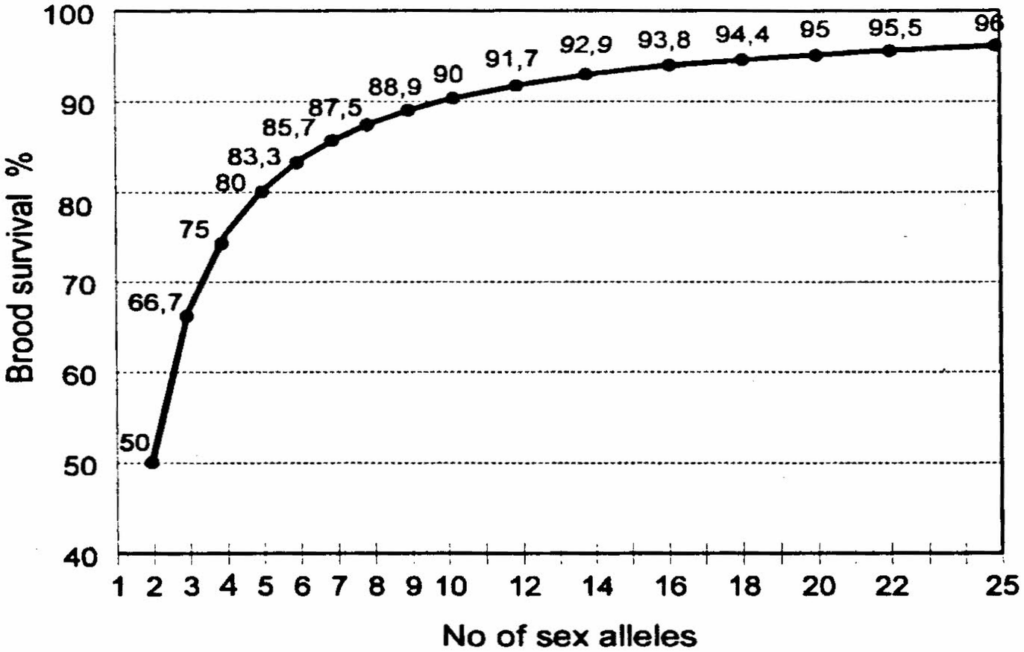
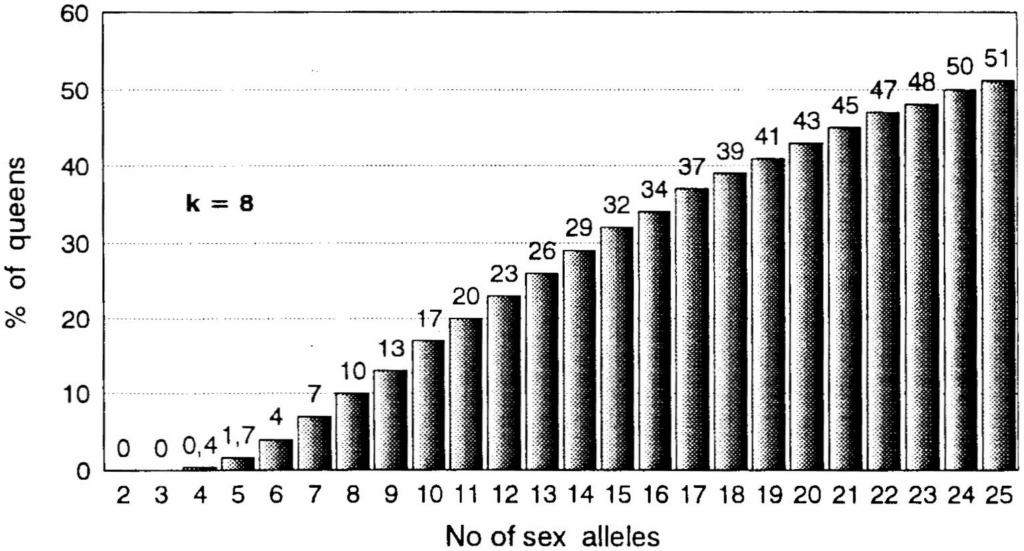
Average brood survival. According to W o y k e (1976), the average survival rate of brood (S%) depends upon the number of sex alleles (N) present in a honeybee population: S% = 100(N-2)/N. Fig. 1 shows, that an increase in the number of sex alleles from 2 up to 5 results in a rapid increase in the percentage of surviving brood from 50 to 80%. A further increase from 5 up to 8 alleles will improve the survival of brood much less, up to 87.5%. Thereafter the survival of brood is increased very little. Average brood survival in populations with 12, 20 or 25 alleles is 91.5, 95.0 and 96% respectively.
Distribution of queens. Each queen has two sex alleles. The ratio of the 2 sex alleles of the queen to the total number of sex alleles in the population (N) is p = 2/N, and of the rest of the alleles is q = (N-2)/N. The
strona 117distribution of queens (Q) mating with different number of drones having either sex allele identical (p) or different (q) to queens’ alleles is: Q = (p + q)^k = [2/N + (N-2)/N]^k, where k = number of (matings) mating drones. The survival rate of brood (S%) produced by a queen depends upon the total number of matings (k) and the number of matings with drones having the same sex alleles (y) as the queen have: S% = 100(1-y/2k). Theoretically, the number of classes of a binomial equation (p + q)^k is k + 1.
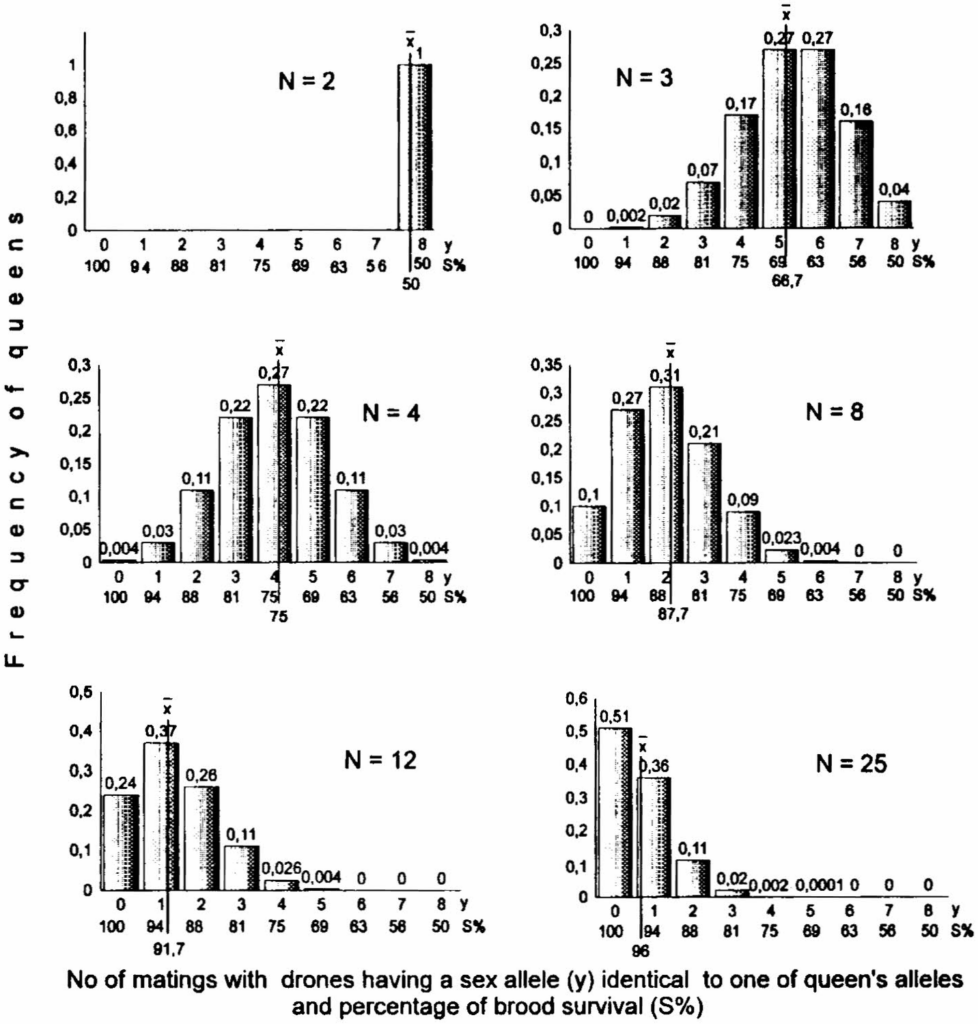
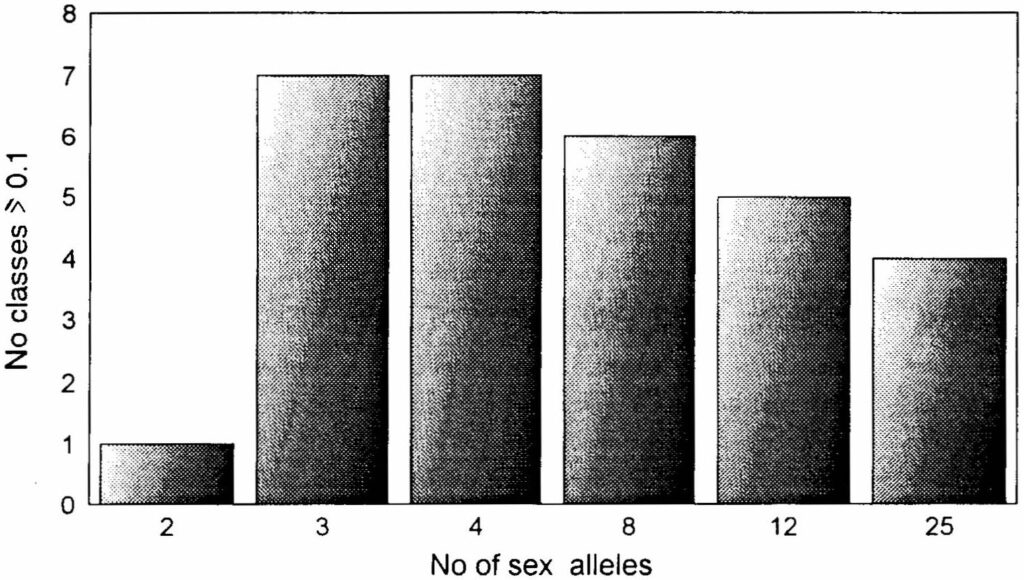
Effect of number of sex alleles on the distribution of queens producing brood of different survival rate. In populations with constant number of matings, the distribution of queens producing brood of different survival rate depends upon the number of sex alleles (fig. 2). In population with 2 sex alleles, only the p alleles are present. Therefore only 1 class of queens is present (fig. 2, N = 2). In populations with more alleles, and k = 8 matings, the number of classes of queens producing brood of different survival rate is constant 8 + 1 = 9. This number is independent upon the number of sex alleles in a population. However, fig. 2 shows, that the frequency of some classes is extremely low. Figs 2 and 3 show, that the number of classes whose frequency is ≥ 0.1 decreases (in populations with more than N = 2 alleles), from 7 (N = 3) to 4 (N = 25).
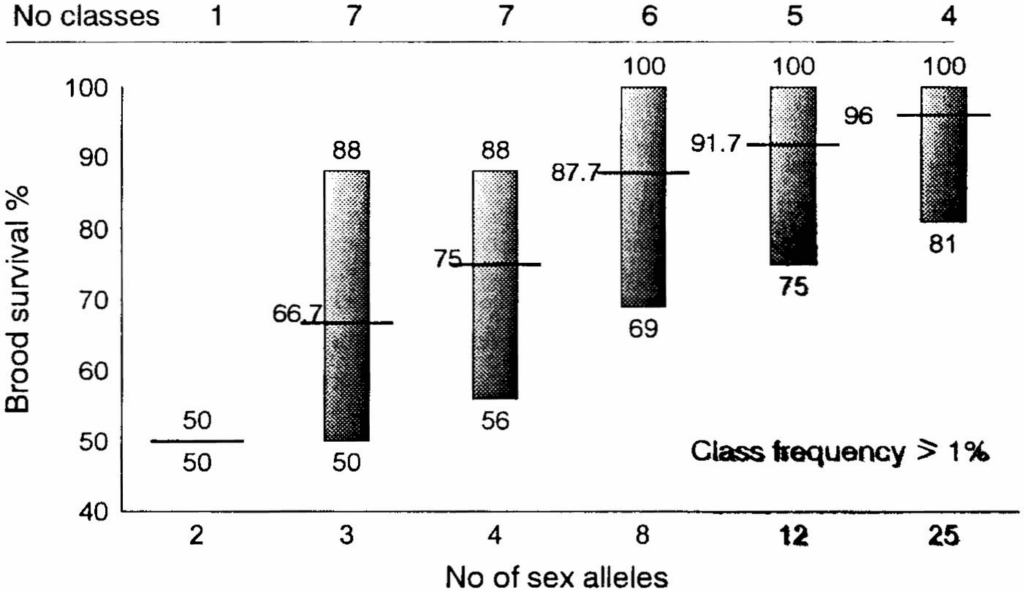
Fig. 4 shows, that the range of brood survival changes from 50 – 88% in population with N = 3 alleles to 75 – 100% (N = 12), and to 81 – 100% (N = 25). Thus, the lower, as well as the higher limit of the range increases, with the increase of the number of alleles in the population. At the same time, the expansion of the range decreases. Hence, increased number of alleles results in aggregation of classes of queens producing brood of different survival rate around the mean brood survival for that population.
The frequency value of the most frequent class (the modal), increases from 0.27, in population with N = 3 alleles to 0.37 (N = 12), and to 0.51 (N = 25) (fig. 2).
The frequency of queens producing brood of 50% survival can be calculated from the equation p = (2/N)^k. When all queens are mated to k = 8 drones, p = (2/N)^8. In population with N = 2 sex alleles, 100% of queens produce brood of 50% survival rate. The increase of the number of sex alleles to N = 3, 4, 5 and 6 results in 29.6, 6.3, 1.0 and 0.1 % of queens producing brood of 50% survival rate, respectively. Thus, in populations with 5 or more sex alleles, queens producing brood of 50% survival, practically do not appear. Hence, the increase of the number of sex alleles results in very quickly decrease of the frequency of the „50% queens”.
Frequency of queens producing brood surviving in 100% can be calculated from the equation q = [(N-2)/N]^k. In population with 2 sex alleles, no one queen produces brood of 100% survival rate. In population with 3 sex alleles, only 0.015% of queens mated to 8 drones produce brood of 100% survival rate. Fig. 5 shows, that with the increase of the number of
strona 118sex alleles, the frequency of queens producing brood of 100% survival rate also increase. In populations with 12, 25, 50 and 100 alleles, 23, 51, 72 and 85% of queens produce brood of 100% survival, respectively.
Effect of the number of matings on the distribution of queens producing brood of different survival rate. In population with constant number of sex alleles (N = 12), p = 2/N = 2/12 = 0.167, and q = (N-2)/N = 10/12 = 0.833. Thus the equation for the binomial probability distribution is :
Q = (p + q)^k = (0.167 + 0.883)^k
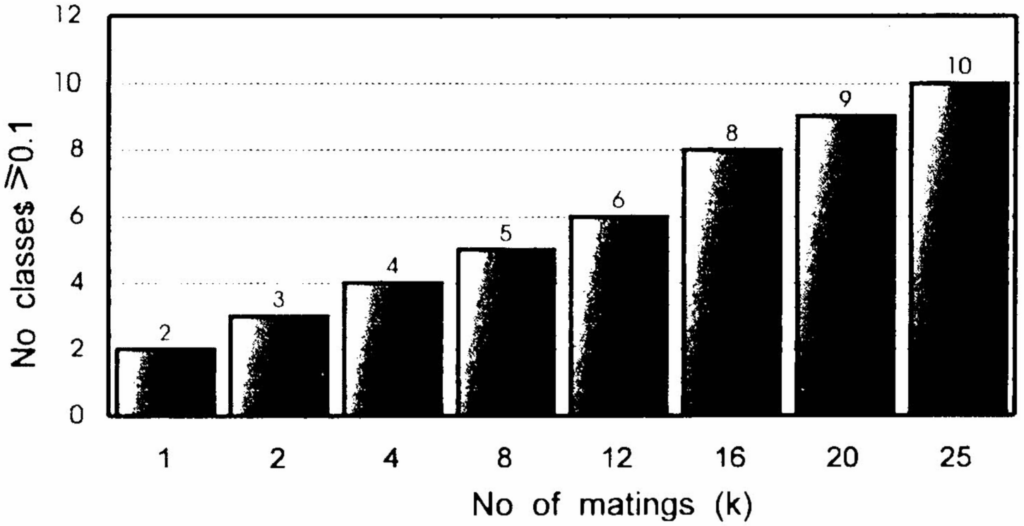
Fig. 6 shows, that increasing the number of matings results in the increase of the number of classes of queens producing brood of different survival rate. Theoretically the number of classes of a binomial power equation (p + q)^k is k + 1. However, frequencies of some classes are extremely low. The number of classes whose frequencies are equal or higher than 0.01 (1%), increases from 2 (for k = 2 matings) to 10 (k = 25), (Figs 6 and 7). The brood survival for those classes ranges from 50 – 100%, (for k = 1 mating); to 82 – 100%, (k = 25), (figs 6 and 8). Thus, the increased number of matings results in decreasing the expansion of the range of brood survival. Brood survival of 100% is produced in frequencies ≥ 0.01 (1%) by queens mated as well by 1 as by 25 drones. However, the lower limit of the range of brood survival increases from 50% (k = 1) to 75% (k = 8), and 82% (k = 25), (fig. 8).
strona 121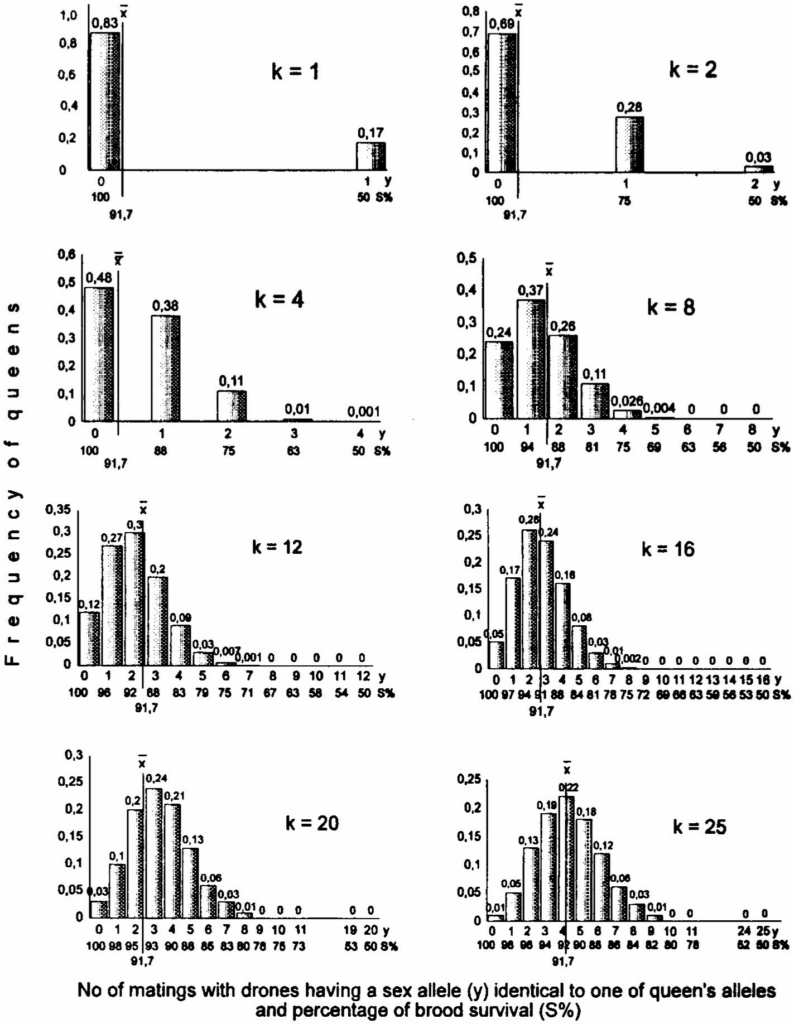
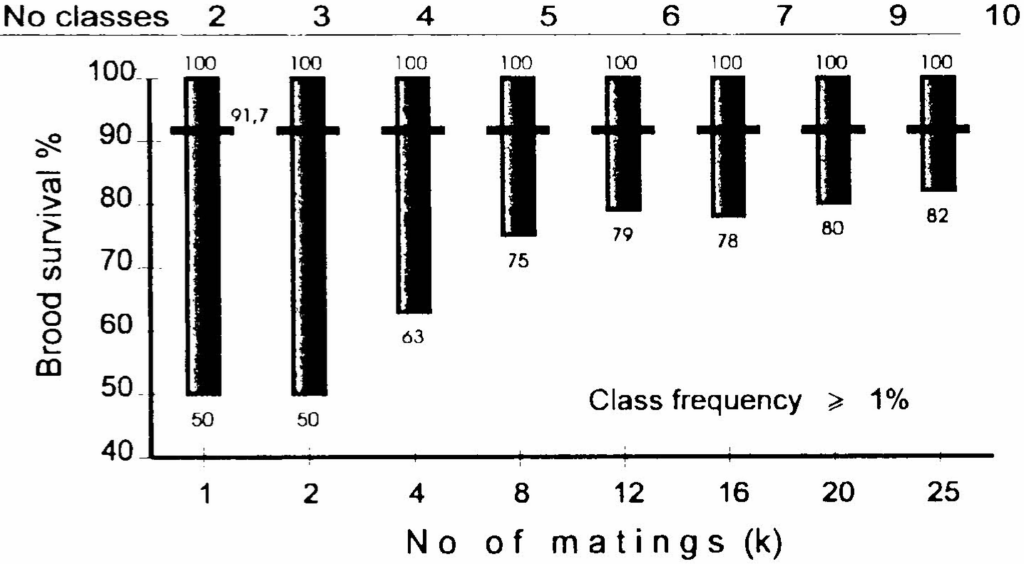
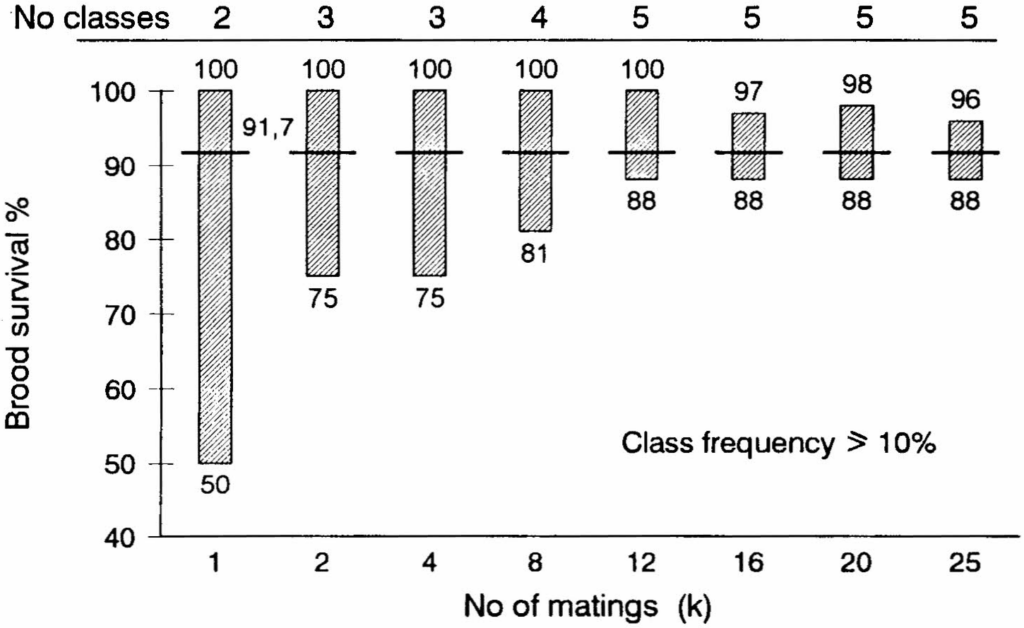
The number of queen classes whose frequency is ≥ 10% ranges from 2 (k = 1) to 4 (k = 8), and 5 (k = 25), (fig. 9). Thus, the number of those
strona 123classes is much lower (up to 5), than for frequencies ≥ 1% (up to 10). The lower limit of the range of brood survival is higher. However, after queens are mated to 16 or more drones, less than 10% produce brood of 100% survival rate (fig.9).
The number of queen classes whose frequency is ≥ 20% ranges from 1 -3 (fig. 11). The highest number of classes of that frequency occurs in queens mated with 8 or 12 drones. Classes of queens mated with more than 8 drones and producing brood surviving in 100% are all below 20% frequency (fig. 10).
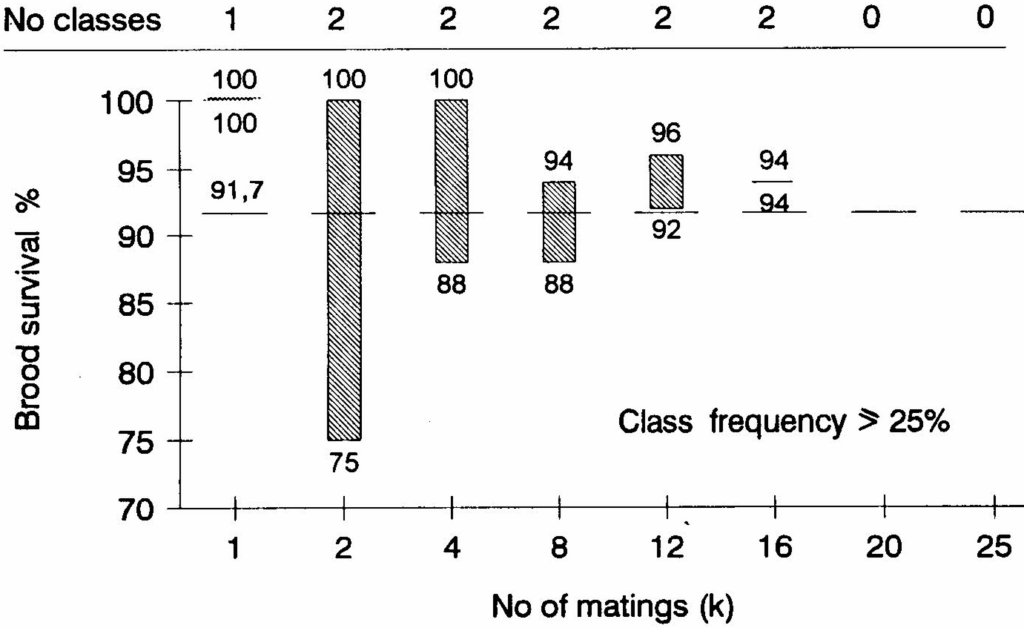
Within all mating combinations studied, k = 1 – 25, there are only 0 – 2 queen classes whose frequency is ≥ 0.25 (fig. 6 and 11). When queens are mated with 8 or more drones, less than 25% produce brood of 100% survival (fig. 11). After 20 or more matings, there does not exist any queen class of 0.25 frequency (fig. 11).
Thus, the increased number of matings aggregates the queen classes producing brood of different survival around the mean brood survival for the whole population of a given number of alleles (x = 91.7%, N = 12).
As a result, the extreme classes diminish. Fig 6 shows, that after the queens are mated to 1, 2 or 4 drones, the frequencies of those producing
strona 124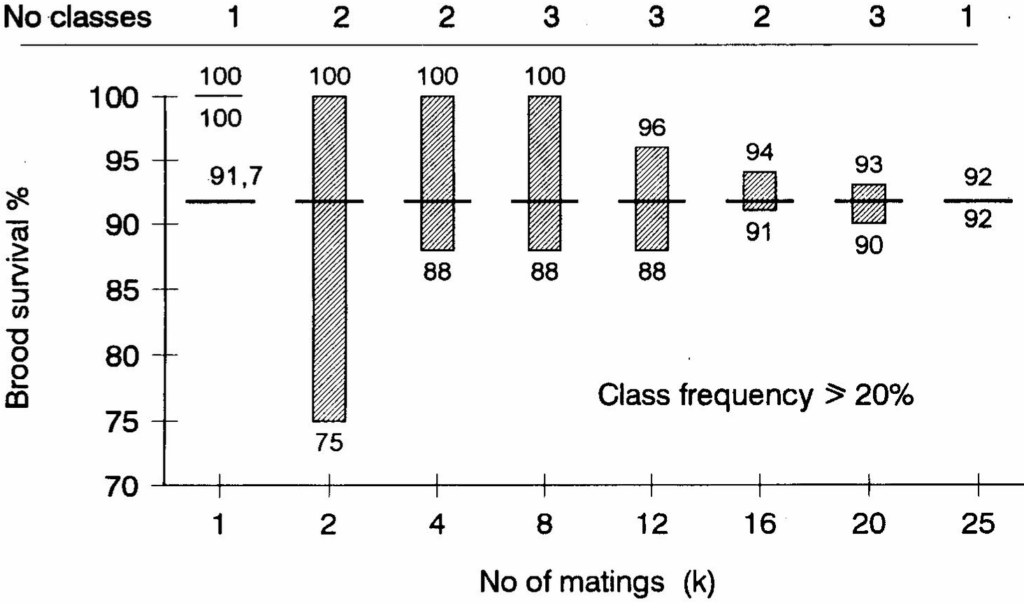
brood of 50% survival rate diminish to 0.17, 0.03 and 0.001, respectively. Figs 6 shows also, that the increase of the number of matings results likewise in diminishing the frequencies of queens producing brood of 100% survival. Fig. 12 shows, that matings to 1, 4, 8, 16 and 25 drones, diminish the frequencies of queens producing brood of 100% survival to 0.83, 0.48, 0.23, 0.05 and 0.001, respectively. This is understandable. When queens are mating with higher number of drone, there is greater chance to meet drones having sex allele identical to theirs, and this results in homozygotes.
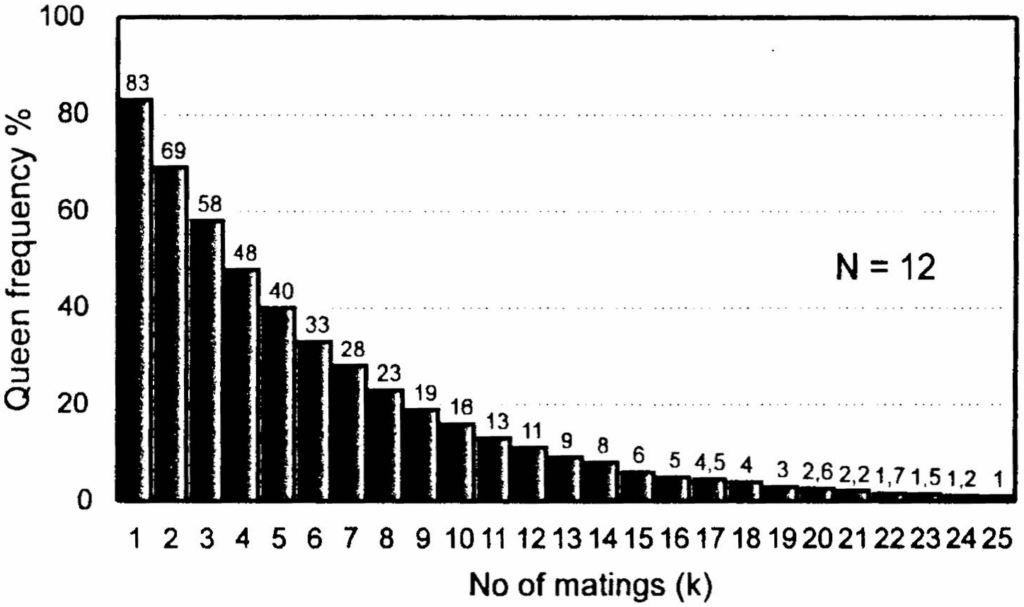
Fig. 6 shows, that the increase of the number of matings results in a decrease of the value of the most frequent class (the modal). Fig. 13 shows, that mating to 1, 4, 8, and 25 drones diminishes the value of the most frequent class to 0.83, 0.4⁹[?], 0.37 and 0.22 frequency, respectively. This is caused by the increased number of classes from 2 (after k = 2) to 10 (after k = 25) (fig. 7). Consequently, the total population of queens is distributed between few classes after they are mated to few drones, and between more class after the queens are mated to many drones. As a result, the most frequent class is lower.
strona 126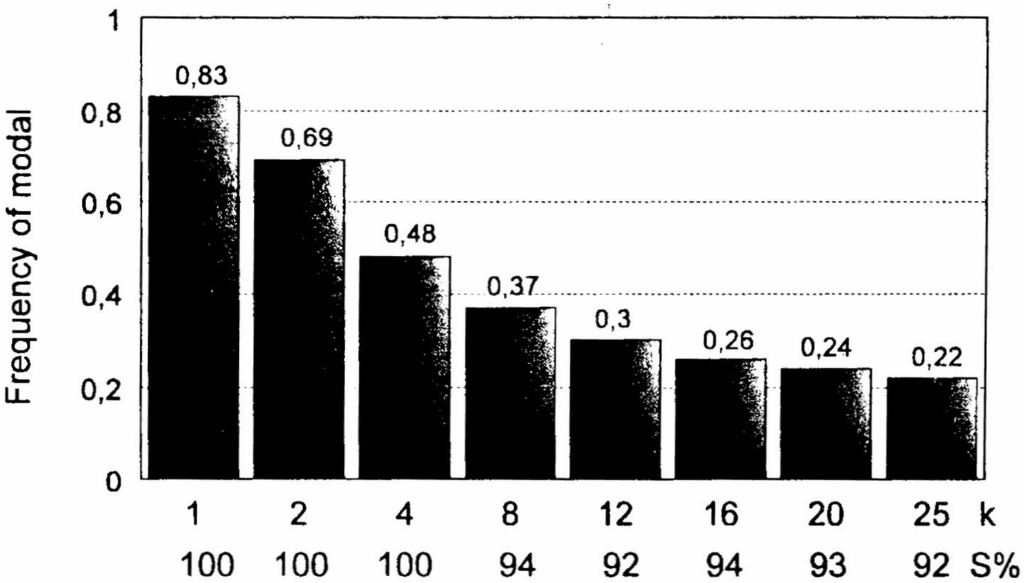
The above results show, that an increase of the number of sex alleles in honeybee population results in: 1.) decreasing the number of queen classes whose frequency is ≥ 1%, and 2.) increasing the frequency of queens producing brood of 100% survival rate. The increase of the number of matings results in: 1.) increasing the number of queen classes whose frequency is ≥ 1%, 2.) aggregation of queen classes around the mean for the population, and 3.) decreasing the frequency of queens producing brood of 100% survival rate.
LITERATURE
M a c k e n s e n O. (1951) – Viability and sex determination in the honeybee (Apis mellifera L.). Genetics, 36(5):500-509.
P a g e R. E., L a i d l a w H. H. (1982) – Closed population honeybee breeding. I. Population genetics of sex determination. J.Apic.Res., 21(1):30-37.
S z a s k o l s k i j D. W. (1968) – Raspriedielienie serii mnożestwiennych allieliej w tieorieticzieskich populiacjach w swiazi s biologiei razmnożienia miedonosnoj pczeĺy. Genetika, 4(10):41-55.
W o y k e J. (1962) – The hatchability of „lethal” eggs in two sex allele fraternity of honeybees. J.Apic.Res., 1(1):6-13.
W o y k e J. (1963a) – Drone larvae from fertilized eggs of the honeybee. J.Apic.Res.,
strona 1272(1):19-24.
W o y k e J. (1963b) – What happens to diploid drone larvae in a honeybee colony. J. Apic. Res., 2(2):73-76.
W o y k e J. (1969) – A method of rearing diploid drones in a honeybee colony. J.Apic.Res., 8(2):65-71.
W o y k e J. (1972) – Sex allele und kontrolierte Paarung. Intern. Symp.: Paarungskontrolle und Selektion bei der Honigbiene. Lunz am See, 69-74 s.
W o y k e J. (1976) – Population genetic studies on sex alleles in the honeybee using the example of the Kangaroo Island bee sanctuary. J.Apic.Res., 15(3/4):105-123.
W o y k e J. (1980) – Effect of sex allele homo-heterozygosity on honeybee colony population and on their honey production. 1. Favourable development conditions. J.Apic. Res., 19(1):51-63.
W o y k e J. (1981) – Effect of sex allele homo-heterozygosity on honeybee colony population and on their honey production. 2. Unfavourable development conditions and restricted queens. J.Apic.Res., 20(3):148-155.
Y o k o y a m a S., N e i M. (1979) – Population dynamics of sex-determining alleles in honey bees and self-incompatibility alleles in plants. Genetics, 91(3):609-626.
STUDIA TEORETYCZNE NAD WPŁYWEM LICZBY ALLELI PŁCI W POPULACJI PSZCZÓŁ I LICZBY UNASIENIEŃ NA ROZKŁAD CZĘSTOTLIWOŚCI WYSTĘPOWANIA MATEK PRODUKUJĄCYCH CZERW O RÓŻNEJ PRZEŻYWALNOŚCI
J. Woyke
Streszczenie
Przeżywalność czerwiu produkowanego przez matki zależy od dwu czynników: liczby alleli płci (N) w populacji pszczół i liczby kopulacji (k). Przez liczbę kopulacji rozumie się liczbę kopulujących trutni dobieranych losowo z całej populacji.
Pszczelarz powinien być w stanie przewidzieć przeżywalność czerwiu (S%) od matek pochodzących z różnych populacji i unasienianych różną liczbą trutni.
Średnia przeżywalność czerwiu produkowanego przez różne matki zależy od liczby alleli płci w populacji, S% = 100(N-1)/N i jest niezależna od liczby kopulacji (ryc. 1). Przy niewielkiej liczbie alleli płci w populacji, wzrost ich liczby prowadzi do znacznego polepszenia przeżywlności czerwiu. Wzrost alleli powyżej 12, tylko w nieznacznym stopniu przyczynia się do polepszenia przeżywalności czerwiu.
Częstotliwość występowania klas matek produkujących czerw o różnej przeżywalności rozkłada się zgodnie z rozwiniętym dwumianem: Q = [2/N + (N-2)/N]^k. Liczba klas matek rozkładu równa się k + 1. Przy stałej liczbie kopulacji k = 8, liczba klas matek produkujących czerw o różnej przeżywalności jest stała 8 + 1 = 9 i niezależna od liczby alleli płci w populacji. Jednakowoż, częstotliwość niektórych klas jest tak mała, że nie ma praktycznego znaczenia (ryc. 2). Liczba klas których częstotliwość jest ≥ 1%, zmniejsza się z 7 (N = 3) do 4 (N = 25) (ryc. 3). Przeżywalność czerwiu tych klas matek zmienia się w granicach od 50 – 88% (dla N = 3), do 81-100% (dla N = 25) (ryc. 4). Częstotliwość występowania matek produkujących czerw o przeżywalności 100% zwiększa z 0.014% (dla N = 3) do 23% (N = 12), do 51% (N = 25) (ryc. 5) i do 85% (N = 100).
Przy stałej liczbie alleli płci w populacji N = 12, liczba klas matek produkujących
strona 128czerw o różnej przeżywalności zależy od liczby kopulacji (k) i wynosi k + 1 (ryc. 6). Liczba klas matek, których częstotliwość jest ≥ 1% zwiększa się z 2 (dla k = 1) do 10 (k = 25) (ryc. 7). Przeżywalność czerwiu tych klas matek zmienia się w granicach od 50 – 100% (dla k = 1), do 82 – 100% (k=25) (ryc. 8). Zwiększenie liczby kopulacji prowadzi więc do skupiania się klas matek wokół średniej przeżywalności czerwiu całej populacji. Częstotliwość występowania matek produkujących czerw o przeżywalności 100% zmniejsza się z 83% (dla k = 1) do 23% (k=8) i 1% (k=25) (ryc. 12).
Widać więc, że zwiększenie liczby alleli płci w populacji prowadzi do zmniejszenia liczby klas matek o częstotliwości występowania ≥ 1% i zwiększania częstotliwości występowania matek produkujących czerw o przeżywalności 100%. Natomiast zwiększenie liczby kopulacji prowadzi do zwiększenia liczby klas matek o częstotliwości występowania ≥ 1%, skupiania się ich wokół średniej dla populacji i zmniejsznia częstotliwości występowania matek produkujących czerw o przeżywalności 100%.
Słowa kluczowe: matka, rozkład, allele płciowe, przeżywalność czerwiu, kopulacja.
Errata — błędy druku znalezione podczas digitalizacji
- s. 115, streszczenie: „from 85% (k = 1)” → from 83% (k = 1)
- s. 116: „S% = 100(N-2)/N” → S% = 100(N-1)/N
- s. 116: „is 91.5, 95.0″ → is 91.7, 95.0
- s. 119, ryc. 4: „w poprzeg” → w poprzek
- s. 120, ryc. 5: „częsotliwość” → częstotliwość
- s. 120: „(0.167 + 0.883)^k” → (0.167 + 0.833)^k
- s. 120: „from 2 (for k = 2 matings)” → from 2 (for k = 1 matings)
- s. 123: „from 1 -3 (fig. 11)” → from 1 -3 (fig. 10)
- s. 125: „0.05 and 0.001″ → 0.05 and 0.01
- s. 125, ryc. 12: „częsotliwość” → częstotliwość
- s. 126, piśmiennictwo: „pczeĺy” → pczeły
- s. 127, piśmiennictwo: „kontrolierte” → kontrollierte
- s. 127, streszczenie: „przeżywlności” → przeżywalności
- s. 128, streszczenie: „zmniejsznia” → zmniejszania