

MODELLING OF ENERGETICAL BALANCE OF HONEYBEE WINTERING GENERATION
tekst: E. Stalidzans, A. Krauze, A. Berzonis
Pszczelnicze Zeszyty Naukowe, Rok XLIV, Nr 2, 2000 — E. Stalidzans, A. Krauze, A. Berzonis
strona 55PSZCZELNICZE ZESZYTY NAUKOWE Rok XLIV, Nr 2 2000
E. Stalidzans¹, A.Krauze², A. Berzonis³
¹ Riga Technical University, Institute of Computer Control, Automatics and Computer Technics 1 Meza Str., Riga, LV 1048, Latvia
² Latvian University of Agriculture, Agriculture Faculty, Liela Str.2, Jelgava, LV 3001, Latvia
³ Biskopibas Laboratorija SIA, Ceraukstes 12, Riga, LV 1004, Latvia
Summary
The developed model links the spent energy of an individual bee, as well as bee colony (25000±5000 bees) to air temperature changes. A case of healthy bees living in a thermally non-insulated hive, which is protected from solar radiation, is presented. The lifetime of wintering bees is divided into three intervals: 1-st interval – since the birth of the first wintering bee until the moment when the average daily temperature drops to +8°C in the given climatic circumstances; 2-nd – interval when the average daily air temperature is within the range between +8°C and 2±2°C, and 3-rd interval – when the average daily temperature is higher than 2±2°C. For each interval, a separate linear equation links the spent power of individual bee with air temperature. The experimental results described in literature are used to determine the coefficients of the equations. The hypothesis of „eaten life” is assumed: the energy resource of an individual bee is 1,8±0,1 Wh. That means – the energy resource of a bee colony is 1,8n, where n – number of wintering bees. Each bee dies after spending (eating) its energy resource. The lifespan depends on the air temperature during a bee’s lifetime.
The energetical balance of a bee colony Q=Q1 + Q2 + Q3, where Qi – the energy spent during the corresponding interval. The model allows to forecast the climatic zones where outdoor wintering becomes critical (Qn > Q3 > Qmin; Qn – required energy for a normal development of a colony; Qmin – minimum energy for colony to survive) or impossible (Q3 = 0). That happens, if, during the first two intervals, bees spend too much energy, so that there is too little energy (or no energy at all) left for the third interval (intensive breeding period). The model confirms the hypothesis that during the accumulation period of wintering bees, the wintering bees are spending less energy (food) than the colony in average.
The model allows to forecast how the energy spending is influenced by altering the wintering circumstances, for instance, insulating hives, indoor wintering. It is possible to calculate the optimum moments for alteration of wintering circumstances.
Keywords: wintering of bees, energetical balance, modelling.
INTRODUCTION
The first step in developing computer control for a biological system is the understanding of the investigated object and creation of a model in a form
strona 56accessible for computer technology. Models are getting more and more necessary in beekeeping as well.
Solving of bee wintering problems in experimental way is a very painstaking job and often the results are applicable only to the given climatic region and bee subspecies. By using an energy model for wintering bee generation it is possible with small number of experiments to confirm or contradict the assumptions used in the model.
The earlier created model of bee colony development (Stalidzans and Berzonis 1999), where the wintering period of honeybee was included, is not directly connected to the climatic circumstances, in which the development takes place. Thus the assumed input parameters conform to an approximately definite geographic area.
The goal is to work out a model of energy use over time by individual wintering bees and by the colony in total dependence on the climatical circumstances (temperature).
MATHERIALS AND METHODS
The model is created under following assumptions:
— healthy bee colony (25000±5000 bees) with bee queen are wintered in a thermally non-insulated hive in place, which is protected from solar radiation;
— the colony has enough quantity of quality food;
— energy resource of one bee is 1,8 ±0,1 Wh (Stalidzans et al. 1999);
Using results of experimental works (Eskov, 1990), (Gareev, 1969) (Figure 1) the whole lifetime of wintering bees is split into three periods depending on the capacity of energy use: 1st – summer-autumn period, from the birth of first wintering bee until the moment when long-term average day and night temperature in the region decreases till tom1 = + 8°C (segment A); 2nd – winter period, when temperature after +8°C reaches its minimum in winter and after that increases till t°m2 = 2±2°C (segment B); 3rd – spring period, when the temperature rises over t°m2 = 2±2°C (segment C).
The total balance of energy Q used by wintering bee generation is:
Q = Q1 + Q2 + Q3
where, Q1, Q2 and Q3 – energy spent in respective periods [Wd or honey in kgs; 1 kg honey = 3,17 kWh].
Energy resource of wintering bee generation Q can be calculated by equation:
Q = 1,8 n / 24 [Wd]
where n – average number of wintering bees in the 2nd period [pcs.]; 1,8 Wh – average amount of energy spent during lifetime by one bee; 24 – amount of hours in day and night.
strona 57Dynamics of energy spent by one bee can be calculated by equation:
Q¹(t1, t2) = ∫_{t1}^{t2} q (p (τ)) dτ
where Q¹(t1,t2) – energy spent by one bee within time interval t1,t2; q(t°) – energy spent by one bee at the ambient air temperature t°; p(τ) ambient air temperature in the moment τ.
Bee colony spent energy in time interval t1,t2:
Q (t1, t2) = n (t1, t2) Q¹ (t1, t2)
where n(t1,t2) – average amount of bees in the colony within time interval t1,t2.
Energy consumption Qi in period i (autumn i=1, winter i=2, spring i=3) using average values of q(t°):
Qi = ni Ni Δτi
where ni – average number of bees in the period i, [pcs.]; Ni – average power spent by one bee [W] at temperatures in period Δτi [d].
Ni values can be calculated by equation:
Ni = ai ti° + bi
where ai and bi – coefficients of linear equations; t°i – average temperature in period τi.
Using the above described equations and assuming sinusoidal temperature change over the year with extremes in January and July it is possible to calculate the lifespan of each wintering bee in any geographic region. Knowing the long-term average temperatures of January and July the temperature in Northern Hemisphere on any day, starting from 1-st January can be approximately calculated using equation:
t° = [ (t°07 − t°01) / 2 sin (ωτ + φ) ] + (t°07 + t°01) / 2
where t°01 and t°07 – regional average temperatures in January and July; ω = 2π/365 = 0,017; τ – day, counting from the 1-st January; φ =255π/180 = 4,451.
It is possible to use real data about temperatures in form of table or function to get results for a particular case.
RESULTS
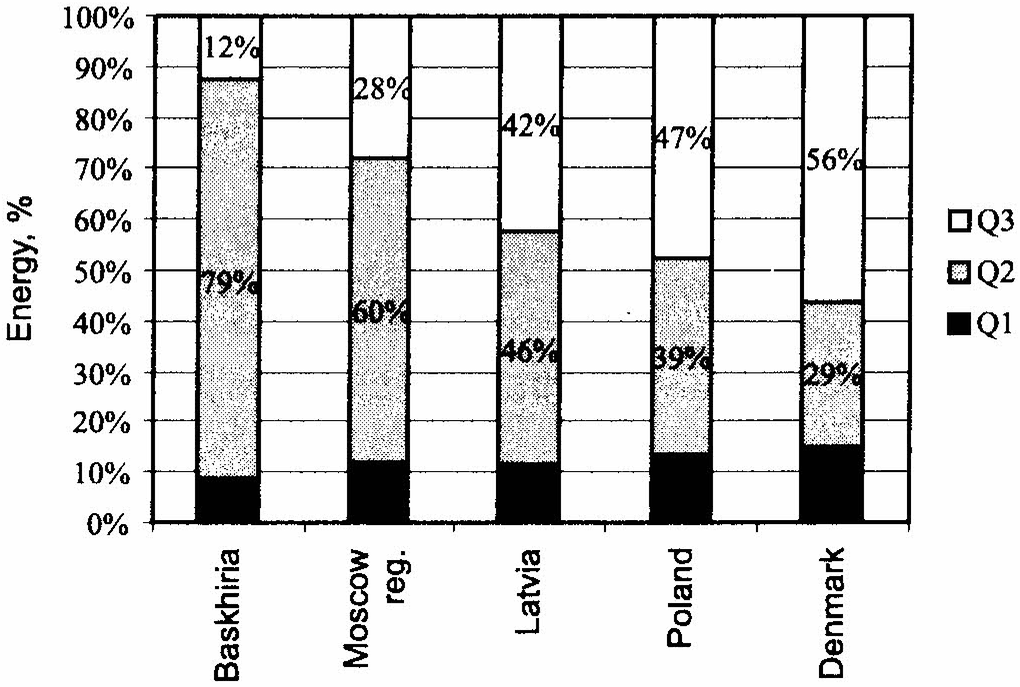
Energy balances are calculated under different climatic circumstances using following parameters: a1 = 0,032; a2 = -0,014; a3 = 0.06; b1 = -0,18; b2 = 0,185 and b3 = 0,29; t°m1 = 8°C; t°m2 = 3°C. They are shown in Figure 2.
strona 58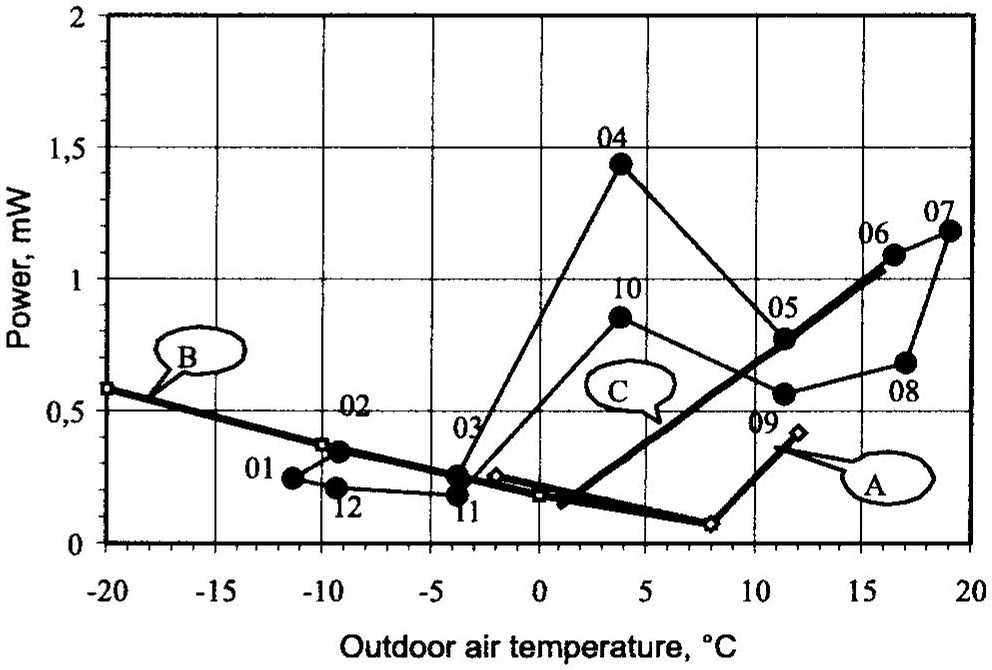
Model is made in MS Excel program, Visual Basic version.
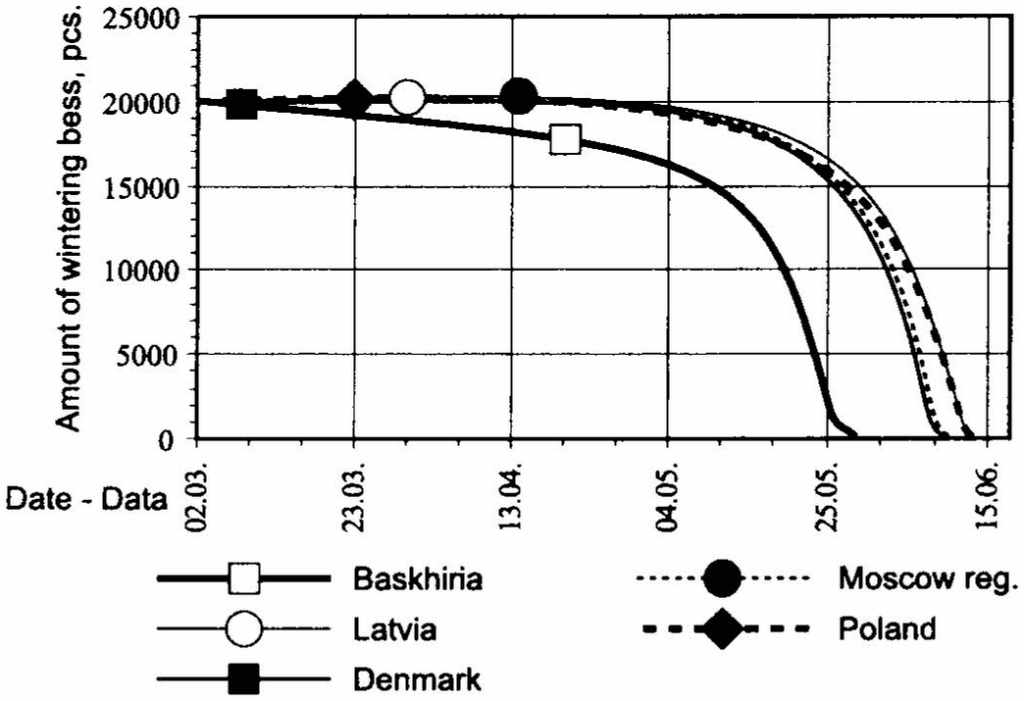
Dynamics of death of wintering bees generation are calculated using the a.m. parameters (Figure 3). Increase of July temperature for one degree January temperature being the same makes life of wintering bees about two days shorter. Decreasing of July temperature makes the lifespan longer.
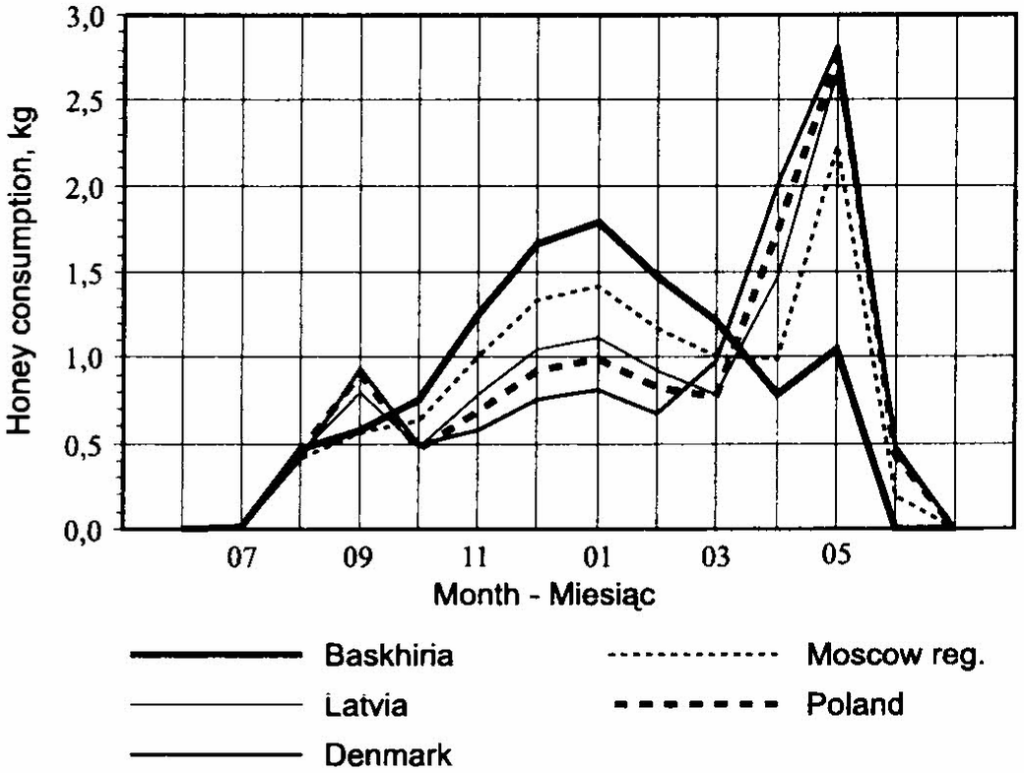
Monthly honey consumption by wintering bees generation under different climatic circumstances using the above-described method is shown in Figure 4.
strona 60DISCUSSION
For modelling the energy balance of wintering bee generation the best described experimental data (Eskov, 1990), (Figure 1) were used. Yet the values of energy consumption turned out to be wrong because, under climatic circumstances where bee wintering actually takes place, according to the calculations the bees could not have survived.
There are several possible reasons for too high values of energy consumption during experiments: – in autumn wintering bees use less energy than the bees in colony average; – during winter increase of energy consumption is caused by brood reared in the cluster (Szabo, 1993), as well as still existing „summer bees”; – methodical errors, for instance, disturbing of colony during experiment. The inexplicably high values which cannot be used for balance calculations are mentioned by Southwick (Southwick, 1982).
To get realistic results regarding capacity of one bee at 8°C the value was left 0,07 mW, but the coefficients of equation for 1st period were changed from a1 = 0,085; b1 = – 0,61 to a1 = 0,061; b1 = – 0,41; for 2nd period from a2 = – 0,017; b2 = 0, 1 to a2 = – 0,013 b2 = 0,175. Gareev’s experiments (Gareev, 1969) allow acquit these changes because the described amount of spent energy is lower than in experiments of Eskov (Eskov, 1990).
The possibility of increasing the energy resource of one bee without decreasing values of spent power was not used, as it would increase the monthly honey consumption over real values.
By making calculations with corrected coefficients it was found that in the autumn (1st period) wintering bees are spending energy at its lowest rate, 5-14% of the total energy consumption; in winter (2nd period) 30-80% and in spring 12-56%.
Calculations indicate that successful outdoor wintering in thermally non-insulated hives is possible in a climatic area where the average temperature in January is not lower than -10°C. At lower temperature the bee death starts simultaneously with or earlier than intensive broad rearing and the number of bees becomes insufficient for normal development of bee colony and the colony does not develop or becomes extinct. Under these circumstances it is possible to use bee wintering indoors, under snow et cetera. It is estimated that the minimal left energy for 3rd period that is necessary to assure normal development of bee colony is about Qkr~0,3Q (Fig. 2). We do not have data to estimate monthly honey consumption in different climatic zones.
strona 61CONCLUSIONS
Modelling energetical balance of wintering bees generation depending on climatic circumstances in the region following results are forecasted:
— successful outdoor wintering of healthy bee colonies in thermally non-insulated hives is possible in regions where the average temperature in January is lower than -10°C;
— The generation of wintering bees in regions where the average January temperature is within the range between -16°C and 0°C, but in July within the range between 16°C and 19°C:
— consumes in autumn 9-15% of the whole energy resource and depending on the average temperature in July in the region;
— consumes in winter 29-79% of the whole energy resource and depending on the average temperature in January in the region;
— consumes the rest in spring, 12-56% of the whole energy resource and depending on the energy spent in autumn and winter;
— has following average monthly consumption of honey for one colony (20 000 bees) depending on climatic circumstances: October 0,5-0,8; November 0,6-1,3; December 0,8-1,7; January 0,8-1,8; February 0,7-1,5; March 0.8-1,2, April 0,8-2; May 1-2,8 kg;
— for normal colony development at the beginning of intensive broad rearing in the spring minimal necessary energy is estimated to be Qkr~0,3Q (30%).
REFERENCES
Stalidzans E., Berzonis A. , (1999)- Analytical Development Model of Bee Colony. 41st issue of series: Boundary Field Problems and Computer Simulation. Environmental Simulation. Riga, RTU, 14-21.
Stalidzans E., Bilinskis V., Berzonis A. (1999)- Hypothesis of modelling energetical balance of bee colonies and changes in the number of bees. Proceedings Apimondia’99 XXXVI Congress, Vancouver, Canada, 278
Eskov E.K. (1990)- Ekologija medonosnoj pcheli. Moscow, Rosagropromizdat, p.118, 198.
Gareev A.N. (1969)- Skolko korma semja rashodujet za zimu. Pcelovodstvo, No.2, p. 22.
Szabo T.I. (1993)- Brood Rearing in Outdoor Wintering Honey Bees Colonies. Am. Bee J., vol. 133, No 8, 579-590.
Southwick E.E., (1982)- Metabolic energy of intact honey bee colonies. Comperative Biochemistry and Physiology, 71: 277-281.
strona 62MODEL BILANSU ENERGETYCZNEGO ZIMUJĄCEGO POKOLENIA PSZCZOŁY MIODNEJ
Stalidzans E., Krause A., Berzonis A.
Streszczenie
Opracowany model łączy wydatkowanie energii przez pojedynczą pszczołę oraz przez całą rodzinę pszczelą (25000 ±5000 pszczół) ze zmianami temperatury zewnętrznej. Model dotyczy zdrowej rodziny pszczelej w nie ocieplonym ulu, osłoniętym przed bezpośrednim działaniem promieni słonecznych. Czas zimowania rodziny pszczelej podzielono na 3 okresy: 1-szy (letnio jesienny) od wyjścia z komórki pierwszej robotnicy pokolenia zimowego do czasu, gdy średnia dzienna temperatura spada do +8°C w danych warunkach klimatycznych; 2-gi (zimowy) gdy średnia dzienna temperatura spada poniżej +8°C osiąga swoje minimum zimą i ponownie wzrasta do 2±2°C; i 3-ci (wiosenny) gdy średnia dzienna temperatura jest wyższa niż 2±2°C. Dla każdego z tych okresów opracowano oddzielne równanie, uwzględniający związek między wydatkowaniem energii przez pojedynczą pszczołę a temperaturą zewnętrzną. Współczynniki wykorzystane w tych działaniach przyjęto zgodnie z opisanymi w literaturze danymi eksperymentalnymi.
Przyjęto hipotezę „zjadanego życia”. Zasoby energetyczne indywidualnej robotnicy wynoszą 1,8 ±0,1 Wh, co oznacza, że zasób energii rodziny pszczelej = 1,8 n, gdzie n = liczba pszczół w zimującej rodzinie. Każda pszczoła ginie po zużyciu („zjedzeniu”) swego zasobu energii. Długość życia pszczoły zależy od temperatury otoczenia, panującej w okresie jej życia.
Bilans energetyczny rodziny pszczelej Q = Q1 + Q2 + Q3, gdzie Qi oznacza energię zużytą w czasie odpowiedniego okresu zimowania (pierwszego, drugiego lub trzeciego).
Omawiany model pozwala określić strefy klimatyczne, w których przezimowanie rodzin na pasieczysku (na toczku) staje się problematyczne (Qn > Q3 > Qmin., gdzie Qn = energia potrzebna do normalnego rozwoju rodziny pszczelej, a Qmin = minimalna energia niezbędna dla utrzymania rodziny przy życiu) lub wręcz niemożliwe (Q3 = 0). To zdarza się, gdy w czasie pierwszych dwóch okresów zimowania pszczoły muszą zużyć tak dużo energii, że pozostaje jej zbyt mało (lub nie pozostaje nic) na okres trzeci (okres intensywnego wychowu czerwiu).
Model pozwala na przewidywanie, jak zużywane będą zasoby energii rodziny pszczelej, gdy zmienią się warunki zimowania, np. gdy ule będą ocieplone lub gdy rodziny będą zimować w pomieszczeniach zamkniętych. Przy pomocy modelu możliwe jest określenie czynników istotnych dla zmienienia warunków zimowania pszczół.
Słowa kluczowe: zimowanie pszczół, zasoby energetyczne, model matematyczny.
Errata — błędy druku znalezione podczas digitalizacji
- s. 56: „MATHERIALS” → MATERIALS
- s. 56: „tom1″ → t°m1
- s. 58, ryc. 1: „poza ula ulem” → poza ulem
- s. 58, ryc. 1: „wiosnę podczas” → wiosną podczas
- s. 59, ryc. 3: „wintering bess” → wintering bees
- s. 60: „broad rearing” → brood rearing
- s. 61: „broad rearing” → brood rearing
- s. 61, piśmiennictwo: „Comperative” → Comparative
- s. 62, streszczenie: „uwzględniający” → uwzględniające