

THE ROLE OF FORAGER BEE INFESTATION ON POPULATION DYNAMICS OF VARROA DESTRUCTOR (ANDERSON TRUEMAN 2000)
tekst: Stefan Fuchs, Claudia Kutschker
Pszczelnicze Zeszyty Naukowe, Rok XLIV, Nr 2, 2000 — Stefan Fuchs, Claudia Kutschker
strona 199PSZCZELNICZE ZESZYTY NAUKOWE Rok XLIV, Nr 2 2000
Stefan Fuchs, Claudia Kutschker
Institut für Bienenkunde (Polytechnische Gesellschaft) Fachbereich Biologie der J. W. Goethe-Universität Frankfurt am Main Karl-von-Frisch-Weg 2, 61440 Oberursel, Germany
Summary
From the reproduction of the honey bee parasite Varroa destructor and its actual population growth it was calculated how many mites disappear from the honey bee colonies. A rough calculation indicated that dead mites falling down from the colony which can be recovered on hive inserts comprise less than one-third of the theoretically expected number. Obviously, a considerable fraction of the mites disappear from the colonies in unknown ways.
Varroa mites may get lost with foragers which do not return from foraging. We sampled foragers leaving the colony and calculated forager losses from measures of brood production and worker numbers, thus arriving at an estimate of mite losses. This amounted to about one third of the mites found in hive debris counts during this period, which still left about half of the expected mite losses unaccounted for.
In comparing the infestation of foragers leaving and returning to the hive we found a distinctly lower infestation of the returning foragers. This difference was consistent between two years in the colonies in three and two different bee yards, respectively, and it was more marked in the highly infested colonies. The reasons for this lower infestation in returning foragers are unclear. Possibly mites could have been unloaded in the field or within other hives of lower infestation. Another possibility is, that infested workers did not return to the hive. We hypothesise that not returning to the hive would be adaptive to the colonies as it removes an infesting pathogen from the hive at the comparatively low cost of an aged worker bee, and might be adaptive to the mites as well as it could increase their chance of spread.
Keywords: Varroa destructor, population dynamics, natural fall infestation of foraging bees.
INTRODUCTION
Severe losses of bee colonies through varroosis (e.g. Dietz 1986, Hartwig 1993) are caused by the build up of high populations of the bee mite Varroa destructor within the hives. After first infection of a colony this takes about one to three years (Martin 1998, Kraus and Page 1995) to reach levels to harm or eventually kill colonies at levels of above 3000 mites (Delaplane and Hood 1999). Understanding the determinants of
strona 200population growth thus can be helpful to find methods which limit or slow down population growth. As in any population, four main processes influence population growth. Reproduction and immigration add to a population, opposed to death and emigration which remove animals. However, in Varroa only reproduction is studied in depth (summarised in Fries 1994, Martin 1998), while the opposite process, mortality is in wide parts not clear and population models are based on rough assumptions from insufficient data (Fries et al. 1994, Martin 1998, Calis et al. 1999). Even more so, surprisingly little is known about emigration and immigration, which usually are of key interest in a parasite.
The main tool to study mortality is to monitor dead mites falling from the colony, usually counted on screened bottom inserts (Liebig 1984, Calatayud and Verdu 1993, Brodsgaard and Brodsgaard 1998). However, this is likely to cover only a minor part of mortality, as is evident from a rough calculation. Population increase is usually described by the logistic equation
N = N_oe^rt
where t gives the time and r denominates the intrinsic rate of population increase, which itself is determined by the birth rate b and the death rate d with
r = (b-d)
Assuming that the mites reproduce approximately 2.5-fold in one reproductive cycle of about 19 days (1.3 and 2.7 female offspring in drone and worker brood, respectively, (Fries et al. 1994), without any mite dying, the daily birth rate of b=0.046 / day would then lead to a maximum population of 3814 mites in a season of 180 days. However, mite populations are known to grow roughly only about 10 to 15 fold over this period, which amounts to a daily rate of increase of r=0.014, which corresponds closely to data from Guermant et al. 1990, Korpela et al. 1992, Kraus and Page 1995. From subtracting both figures the daily death rate can be calculated to be d=0.032. Assuming a population of 1000 mites in a colony, the expected number of mites dying each day can then be calculated to be approximately 32. This figure, calculated from gross estimates, closely accords with that derived in a more complex Varroa population growth model (20 – 40, Martin 1997).
Several studies have aimed to relate the number of dead mites counted on bottom inserts to the actual mite populations in the colony as a diagnostic tool. From a selection of these we inferred the mite fall values in populations of 1000 mites (Table 1). Although methods differed widely between these studies, the results show clearly that much fewer mites than the theoretically expected 32 dead mites per day were registered. In none of these studies more than 10 mites per day were recovered.
strona 201Table 1 Dead Varroa mites per day on hive bottom inserts in a total population of 1000 Varroa mites – Dzienny osyp pasożytów Varroa na dno ula przy 1000 pasożytach w rodzinie wg różnych autorów.
| Autor – Autor | Varroa per day – Varroa na dzień |
|---|---|
| Liebig et al. (1984) | 10 |
| Calatayud and Verdu (1993) | 2.6 |
| Fremut (1995) | 5 |
| Brodsgaard and Brodsgaard (1998) | 7 |
Thus, only less than half of the mite mortality is captured by the dead mites found on bottom inserts, while the greater part seem to vanish from the colony in unexplained ways. Where might they go? The specific situation of pathogens in social insects is described by the „conveyor belt” model by Schmid-Hempel (1998). From birth to death individuals are moving through different life stages as if being transported on a conveyor belt. Any pathogen needs to have mechanisms of changing host „upstream” to resist this perpetual drift. We know such mechanisms to exist in Varroa, as the mites prefer young bees to older bees (Kraus et al 1986). A particular result of this situation is that dying individuals leaving the colony may take pathogens with them. We thus first focused on the question how many Varroa mites can be assumed to be removed from a colony by the natural turnover of worker bees, in particular how many could be explained by the daily loss of forager bees which do not return to the hive. As a related question, we were interested in the question whether foragers leaving the hive or returning to the hive would be equally infested.
MATERIAL AND METHODS
Loss of Varroa mites with loss of forager bees
In 1998 we established 6 Varroa infested small colonies, each on 10 frames. We estimated the brood areas every 7 days over a period of 6 weeks, and also the number of bees in the colonies, by scoring the comb area covered. Bee measures were validated three times by sweeping the bees from the combs and weighing the combs with and without bees. From bee weight and brood areas the numbers of hatching bees and subsequently of bees disappearing from the colony were estimated by the method of Bühlmann (1997). We then estimated the numbers of mites on these bees by measuring the forager bee infestation. Forager bees leaving the colony were caught from the flight entrance in 10 l plastic bags. Samples were taken over the entire period, deep frozen and subsequently washed in detergent water to remove and count the mites. Bee numbers were determined by counting. Additionally, dead mites were counted on the bottom inserts at 3d intervals.
strona 202Infestation of foragers leaving the hive and returning to the hive
In 1998, foragers leaving the hive were caught from the flight entrance as described above. Colonies included the six colonies mentioned above, and samples are identical. Nine further colonies were included from two different bee yards. Returning foragers were caught by blocking the flight entrance, and by collecting gathering foragers into a modified battery-operated vacuum cleaner. Additionally, workers samples were taken from brood combs in 13 colonies. We repeated this experiment in 1999 in 27 colonies from two bee yards, but caught returning foragers by sweeping them into plastic sacs. Infestation of these samples was determined as above.
RESULTS
Loss of Varroa mites with loss of forager bees
Table 2 Loss of foragers per day, calculated from estimates of bee numbers and brood production at 12d intervals over 13 weeks, average infestation of foragers calculated from >24 samples taken over that period, loss of Varoa mites with these foragers per day as calculated from both figures, and dead mites found on hive inserts per day calculated from counts at 3d intervals. Dzienne straty zbieraczek ocenione na podstawie pomiaru wychowywanego czerwiu, średnie porażenie zbieraczek, ubytek pasożytów wraz ze zbieraczkami oraz dzienna liczba martwych pasożytów na wkładce wyliczona na podstawie co 3 dniowych obserwacji.
| Colony / Rodzina | Forager loss / Ubytek zbieraczek | Forager infestation / Porażenie zbieraczek | Mite loss / Ubytek pasożytów | Dead mites on inserts / Martwe pasożyty na wkładce |
|---|---|---|---|---|
| 1 | 588.30 | 0.00048 | 0.28 | 1.59 |
| 2 | 798.74 | 0.00147 | 1.17 | 3.84 |
| 3 | 414.59 | 0.00026 | 0.11 | 1.87 |
| 4 | 651.02 | 0.00096 | 0.62 | 1.19 |
| 5 | 483.30 | 0.00083 | 0.40 | 1.64 |
| 6 | 638.90 | 0.00373 | 2.38 | 3.49 |
| Mean | 595.81 | 0.00129 | 0.83 | 2.27 |
| Std | 135.38 | 0.00127 | 0.85 | 1.11 |
Forager loss per day as calculated from estimates of worker number and brood production is given in Table 2, and averaged 595±135 workers per day. The average infestation of foragers flying out from the hive amounted to 0.0013±0.0013 mites per bee. From the infestation of forager bees leaving the hive and the numbers of bees lost each day, the number mite loss was calculated for each colony separately and averaged 0.83±0.85 mites per day. On average, 2.27±1.11 dead mites were found on the hive inserts. The
strona 203estimated number of Varroa mites carried out of the colony thus was 0.36 times that of dead mites registered on hive inserts.
Infestation of foragers leaving the hive and returning to the hive
Pooled numbers of bees and Varroa mites for both years and for the different bee yards are listed in Table 3. In each year and within each year in each of the bee yards the total numbers of mites recovered in the samples was significantly lower than expected in the returning foragers, except bee yard 1 in 1999 (Chi² -test with expected values taking into account the size of the bee sample). Comparing relative infestation, 44 of the 67 paired samples showed a lower infestation of the returning foragers, and only 15 were opposite (Fig. 1). Again, this was significant in each of the two years (Wilcoxon-test: 1998 P<0.001, 1999 P<0.006), with a ratio outflying to returning foragers infestation of 0.43 and 0.47, respectively. It was also significant in each of the bee yards separately in 1999 (Wilcoxon-test , P>0.05). Sample sizes were too small to test this in 1998. Infestation of foragers leaving the hive was about 0.17-fold lower than the infestation of hive bees from the brood combs (0.023±0.018 Varroa / bee, averages from 13 colonies).
Table 3 Numbers of Varroa mites on samples of foragers leaving the hive and returning to the hive in different years and bee yards. Significances were calculated by Chi²-Tests – Liczba pasożytów Varroa stwierdzonych w próbach zbieraczek wylatujących i powracających do ula w różne lata i różnych pasiekach. Istotność oceniona była testem Chi²
| (Bee yard: / Direction:) | Bee yard 1: Leaving | Bee yard 1: Returning | Bee yard 2: Leaving | Bee yard 2: Returning | Bee yard 3: Leaving | Bee yard 3: Returning | Total for years: Leaving | Total for years: Returning |
|---|---|---|---|---|---|---|---|---|
| 1998 | ||||||||
| Mites | 33 | 17 | 22 | 8 | 12 | 3 | 67 | 28 |
| Foragers | 24731 | 23944 | 3516 | 3636 | 561 | 494 | 28808 | 28074 |
| P: | < 0.05 | < 0.01 | < 0.05 | < 0.0005 | ||||
| 1999 | ||||||||
| Mites | 39 | 17 | 41 | 9 | 80 | 26 | ||
| Foragers | 3624 | 2643 | 1772 | 1220 | 5396 | 3686 | ||
| P: | ns | < 0.005 | < 0.001 |
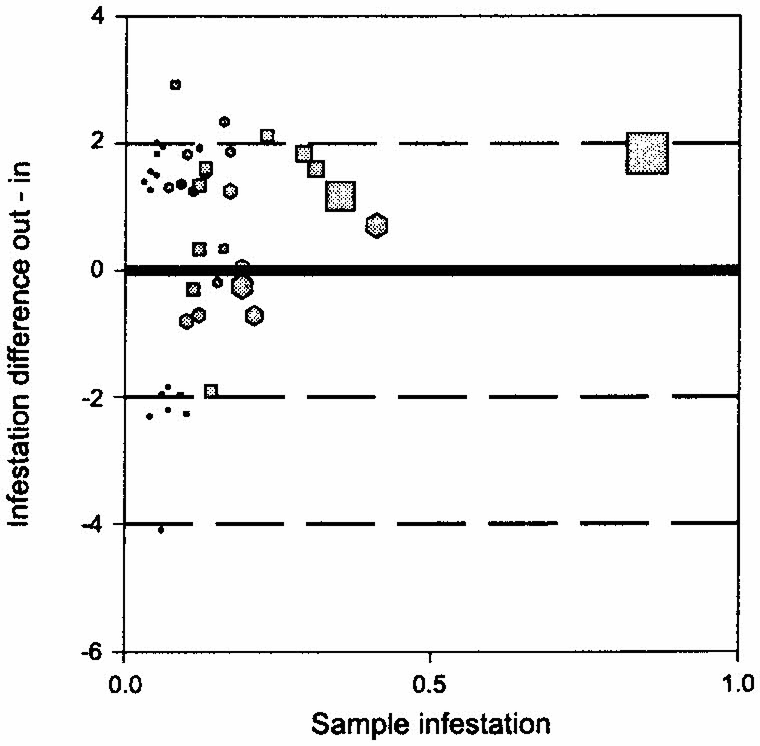
The infestation ratio was more different in the highly infested colonies, as inferred from the infestation of the samples themselves. Fig 2 shows a highly significant correlation of both measures (r=0.808, P<0.0005).
strona 204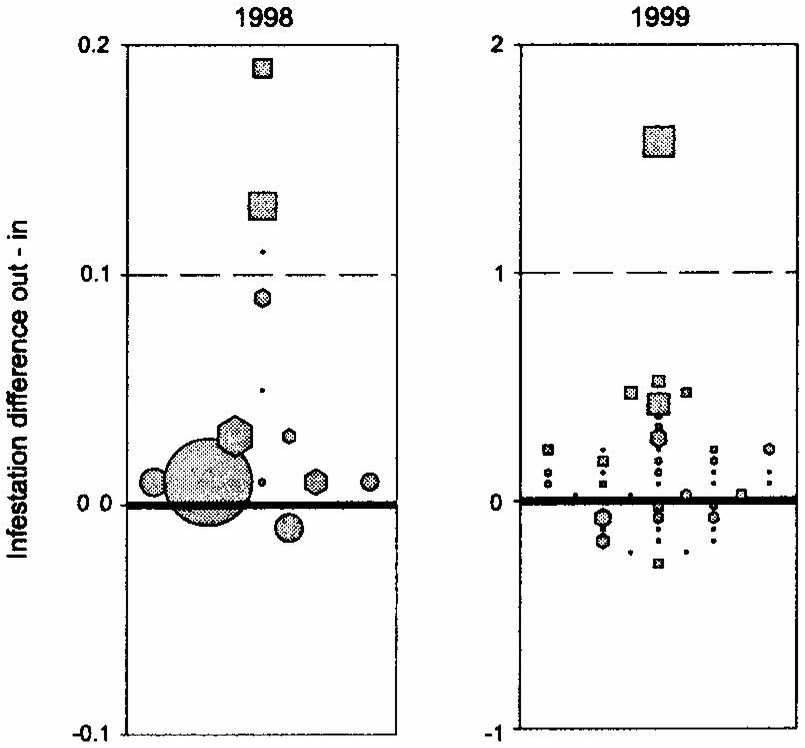
DISCUSSION
Loss of Varroa mites with loss of forager bees
Only a small portion of the expected mite mortality of 32 dead mites in a total mite population of 1000 mites can be explained from mite loss with forager bees not returning to the colony. Assuming that dead mites found on bottom inserts represent about 31% (10 of 32) of the expected dead mites, the 0.36 fold lower estimate for mite loss with foragers derived in this study would add only another 12% (4 of 23) further mites. As a result, more than half of the mite mortality still is unexplained. Part of this fairly moderate contribution of this path for leaving the colony to explain total mite loss is the 0.17-fold lower infestation of forager bees in relation to hive bees. Forager bee infestation relative to hive bee infestation in this study was even lower than in other studies (0.29, Schneider 1985; 0.207 Kraus 1985). Interestingly, this relation has a strong bearing on mite removal. Assuming that foragers were equally infested as hive bees, almost 96% (31 from 23) of the expected mite mortality could be explained by loss with foragers. This draws attention to the possibility that forager infestation relative to hive bee infestation could be a powerful parameter influencing population growth of the mites.
Infestation of foragers leaving the hive and returning to the hive
Measuring infestation of foragers leaving or returning to the hive had yielded an unexpectedly substantial difference, with an about half as high infestation of returning foragers. Obviously quite substantial numbers of mites could leave the colony without returning due to a process which is additional to natural forager loss during foraging, which supposes infestation of leaving and returning foragers to be equal.
It is not clear by which process infestation of returning foragers was lower. There are several possibilities which need to be explored. Infested foragers might be less likely to return to the colony, either by getting lost during foraging in the field, or by being more likely to drift into other colonies. Alternately, mites could be unloaded, again either in the field or in other colonies, such that workers return without a mite. There is little evidence that Varroa mites get unloaded in the field, e.g. on flowers, although this is an attractive possibility as it could be a powerful way contributing to the spread of the parasite if it mounts the next visiting bee. Transport into other colonies by drifting does not seem a very satisfying explanation, as this process would not explain the net mite loss for the entire bee yards. If drifting takes place mainly between the colonies within the bee yard this necessarily would have caused higher infestation of returning foragers in those colonies into which the mites were transported. However, as there might have been other colonies in the vicinity we were unaware of, drifting processes cannot be ruled out with certainty.
strona 206There is some evidence that drifting can be enhanced by high colony infestation levels, as shown by Sakofski (1991). Whether infested bees were more likely to drift or foragers reacted to the infestation level of the entire colony was, however, not clear from that study. To influence forager behaviour towards drifting would be much of the interest of the parasite, as this could enhance its chance of spreading, which is a key feature in each parasite’s life history.
The last possibility, that infested foragers are more likely than uninfested foragers not to return to the hive but to get lost during foraging is attractive as a hypothesis. Not to return would be a behaviour of foragers which could be of great benefit to the colony, as it removes the pathogen. Suicidal behaviour for the benefit of the colony would not be such an unusual trait, as bees are already known to sacrifice their lives by stinging vertebrates to defend the colony. The enhanced drifting reported by Sakofski (1991) could also be the result of a more general disorientation response of diseased workers. Other observations also fit into this picture. Infested workers start foraging at younger age (Sakofski 1990), and colonies after breakdown are almost void of workers. It also fits into theoretical predictions that diseased workers should take higher risks, partly substantiated for Nosema apis (Wociechowski 1998). More detailed studies will clarify whether non-returning of diseased foragers constitutes a new resistance mechanism of high potential to Varroa and possibly other diseases as well.
ACKNOWLEDGEMENTS
We are particularly indebted to G. Bühlmann, who calculated forager loss from our colony data. We further thank the technical staff of our institute, namely B. Springer and M. Ullmann for assistance. We further thank N. Koeniger and G. Koeniger for suggestions on a previous draft of the manuscript.
REFERENCES
Ball B.V. (1988)- The impact of secondary infections in honey bee colonies infested with the parasitic mite Varroa jacobsoni. In: G.R. Needham, R.E. Page, M. Delfinado-Baker, C.E. Bowman eds.: Africanized honey bees and bee mites. Ellis Horwood Ltd., Chichester, 457-461
Broedsgaard C. , Broedsgaard H.F. (1998)- Monitoring method as a basis for need-based control of Varroa mites (Varroa jacobsoni) infesting honey bee (Apis mellifera) colonies. ATLA 26:413-419
Bühlmann G. (1997)- Jahrblatt: Standardtabellen und Berechnungen zum Entwicklungsverlauf von Bienenvölkern: Version dBase IV. Mitteilung der Sektion Bienen der Forschungsanstalt für Milchwirtschaft Liebefeld, Bern. Nr. 22
Calis J.N.M., Fries I., Ryrie S.C. (1999)- Population modelling of Varroa jacobsoni Oud. Apidologie 30, 111-124.
strona 207Bühlmann G. (1997)- Jahrblatt: Standardtabellen und Berechnungen zum Entwicklungsverlauf von Bienenvölkern: Version dBase IV. Mitteilung der Sektion Bienen der Forschungsanstalt für Milchwirtschaft Liebefeld, Bern. Nr. 22
Calis J.N.M., Fries I., Ryrie S.C. (1999)- Population modelling of Varroa jacobsoni Oud. Apidologie 30, 111-124.
Calatayud F. Verdu M.J. (1993)- Hive debris counts in honeybee colonies, a method to estimate the size of small populations and rate of growth of the mite Varroa jacobsoni Oud. (Mesostigmata: Varroidae). Exper. Appl. Acarol. 17: 889-894
Delaplane K. S., Hood W. M. (1999)- Economic threshold for Varroa jacobsoni Oud. In the southeastern USA. Apidologie 30, 383-396
Dietz A. (1986)- The geographical distribution and levels of infestation of the mite Varroa jacobsoni Oudemans (Parasitiformes: Varroidae) in honey bee colonies in Argentina. Am. Bee J. 126 49-51.
Fries I., Camazine S., Sneyd J. (1994)- Population dynamics of Varroa jacobsoni: a model and a review. Bee World 75:5-28
Guermant C., Tursch B., Barbattini R., Chiesa F., D’Agaro M., Havoux J.C. (1990)- Velocite di crescita dell’infestazione da Varroa jacobsoni Oud. nelle colonie di Apis mellifera L. Apic. mod. 81:157-165
Hartwig A. (1994)- An epidemic of *Varroa*sis in Poland 1980 -1993. In: A. Matheson (ed.). New perspectives on Varroa. IBRA, Cardiff, 127-128.
Korpela S., Aarhus A., Fries I., Hansen E.(1992)- Varroa jacobsoni Oud. in cold climates; population growth, winter mortality and influence on the survival of honey bee colonies. J. Apic. Res. 31:157-164
Kraus B., Koeniger N., Fuchs S. (1986)- Unterscheidung zwischen Bienen verschiedenen Alters durch Varroa jacobsoni Oud. und Bevorzugung von Ammenbienen im Sommerbienenvolk. Apidologie 17:257-266
Kraus B. Page R.E. Jr (1995)- Population growth of Varroa jacobsoni Oud in Mediterranean climates of California. Apidologie 26:149-157
Liebig G. (1995)- Bedeutung des natürlichen Milbenfalls. Dtsch. Bienen J. 3:14-15
Liebig G., Schlipf U., Fremuth W., Ludwig W. (1984)- Ergebnisse der Untersuchungen über die Befallsentwicklung der Varroa-Milbe in Stuttgart-Hohenheim in 1983. Allg. dtsch. Imkerztg. 18:185-191
Martin S.J. (1998)- A population model for the ectoparasitic mite Varroa jacobsoni in honey bee (Apis melllifera) colonies. Ecological Modelling 109:267-281
Sakofski F. (1990)- Quantitative Untersuchung der Übertragungswege der parasitischen milbe Varroa jacobsoni Oud. zwischen Völkern der Honigbiene Apis mellifera L. PhD. Thesis, Fachbereich Biologie der J. W. Goethe-Universität Frankfurt am Main
strona 208Sakofski F. (1991)- Quantitative investigations on transfer of Varroa jacobsoni Oud. In: W. Ritter (Ed.): Proc. Intern. Symp. Recent research on bee pathology, Gent 1990, Apimondia, Bucharest 70-72.
Schmid-Hempel P. (1998)- Parasites in social insects. Monographs in Behavior and Ecology, Princeton University Press, Princeton, new Yersey
Schneider P. (1985)- Der Befall von Sammlerinnen, Stockbienen, flugdrohnen und Stockdrohnen mir Varroa jacobsoni. Apidologie 16:209-211
Woyciechowski, M, Kozłowski, J (1998)- Division of labor by division of risk according to worker life expectancy in the honey bee (Apis mellifera L.). Apidologie 29:191-205
ROLA PORAŻONYCH PSZCZÓŁ ZBIERACZEK W DYNAMICE POPULACJI VARROA DESTRUCTOR (ANDERSON TRUEMAN 2000)
Fuchs S., Kutschker C.
Streszczenie
Dokonano szczegółowych badań reprodukcji Varroa destructor i jej wpływu na rozwój populacji pasożyta. Ważny w tym rozwoju proces śmierci pasożytów okazał się mało jasny. Martwe pasożyty spadają z pszczół i można je znaleźć na dnie ula. Jednakże stwierdzona w ten sposób naturalna śmiertelność Varroa wynosiła tylko około 1/3 spodziewanej ilości wynikającej z oceny potencjalnej możliwości reprodukcji i aktualnego wzrostu populacji. Potencjalne możliwości wskazują, że dzienny przyrost populacji powinien wyrażać wskaźnik d=0.045, podczas gdy rzeczywisty przyrost wynosi r=0.014. Dzienna śmiertelność przy współczynniku d=0.032 powinna wynosić 32 martwe pasożyty na każdy 1000 znajdujących się w rodzinie. W obserwacjach stwierdzono mniej niż 10 pasożytów (Tab. 1 ). Oznacza to, że większość pasożytów ginie z rodziny w niewyjaśniony sposób.
Jednym ze sposobów śmierci Varroa może być ginięcie jej wraz z pszczołą zbieraczką, która nie powróci z lotu. W doświadczeniu stwierdzono, że średnie porażenie pszczół opuszczających ul wynosi 0.0013 pasożytów/pszczołę (Tab. 2). Stwierdziliśmy także na podstawie pomiaru czerwiu i wielkości rodziny, że straty pszczół podczas lotu wynoszą 596 w ciągu jednego dnia. W rezultacie ginie w ten sposób 0.8 pasożyta dziennie wobec 2.27 stwierdzanych na wkładce dennicowej. Jeśli więc z wyliczonej dziennej śmiertelności wynoszącej 32 pasożyty 10 spada na dno ula, 4 giną wraz ze zbieraczkami poza ulem to w dalszym ciągu niewyjaśniony jest sposób ubytku ponad połowy pasożytów.
Podczas kolejnych dwóch lat w trzech pasiekach porównaliśmy porażenie pszczół wylatujących i powracających do ula. Stwierdziliśmy wyraźnie większe porażenie u pszczół wylatujących w porównaniu z wracającymi (Tab. 3, Fig. 1 ), a różnica była wyraźniejsza w mocno porażonych rodzinach (Fig. 2).
Powód niższego porażenia warrozą zbieraczek wracających z lotu nie jest jasny. Możliwe, że pasożyty opuszczały pszczoły pozostające poza ulem lub przenosiły się na inne mniej porażone podczas pobytu ich w innych ulach. Inna możliwość to taka, że porażona robotnica nie wraca do ula. Według naszej hipotezy nie wracanie do uli jest sposobem obniżenia porażenia rodziny stosunkowo niskim kosztem, bo utratą części starszych robotnic. Z drugiej strony to zwiększa szansę rozprzestrzeniania się pasożyta.
Słowa kluczowe: Varroa destructor, dynamika populacji, osyp naturalny, porażenie pszczół zbieraczek.
Errata — błędy druku znalezione podczas digitalizacji
- s. 202, tab. 2: „Varoa” → Varroa
- s. 206: „Wociechowski” → Woyciechowski
- s. 207, piśmiennictwo: „melllifera” → mellifera
- s. 208, piśmiennictwo: „new Yersey” → New Jersey
- s. 208, piśmiennictwo: „Stockdrohnen mir” → Stockdrohnen mit